
July 08, 2019
For the nine months ended June 30, 2019, Barita Investments Limited (BIL) recorded a 40% increase in interest income, amounting to $1.04 billion relative to $738.32 million for the comparable period in 2018. Interest expense also recorded an increase to close at $598.85 million compared to $431.36 million in 2018. As a result, net interest income improved 42% to $436.90 million relative to $306.96 million in 2018. Management noted this was, “due to a combination of increased portfolio size and improved net interest margin management.” Net interest income for the quarter closed at $180.48 million, 53% above the $117.64 million reported for the prior year’s corresponding quarter.
Dividend income rose 40% to total $20.89 million compared to the $14.97 million earned for the nine months ended June 30, 2018. Gains on sale of investment increased significantly by 1007%, to $1.24 billion (2018: $111.59 million). BIL stated, that, “gain on investment activities include $1.03 billion related to equity investments under IFRS 9, which was adopted by the Group on October 1, 2018.” Management also noted, “this segment relates to the management of our cambio and proprietary trading portfolio, closed the period registering a 756.8% increase to $1.3 billion when compared with $154.6 million reported in the prior financial year. This was largely driven by fair value gains on investment ($1.03 billion), gains on sale of investment ($203.9 million) for the period, and foreign exchange trading income ($88.6 million). Realized trading income therefore totalled $310.8 million, representing a YoY growth of 227.8%. The key enablers to the growth in trading activity are the increased capitalization of the Group together with the positive year to date performance of the investments held by the company.”
Foreign exchange trading and translation amounted to a gain of $88.59 million compared to a gain of $42.96 million recorded in the previous year’s period. BIL noted, “our local currency has strengthened during our financial year-to-date, resulting in the Group incurring foreign exchange translation losses when compared to gain recorded in the corresponding period last year. The Jamaican dollar closed the period at J$130.5 (the BOJ’s mid-point weighted average buy and sell exchange rates) versus the US dollar, leading the segment to close the period with a loss of $18.3 million. we have however seen a reduction in the adverse effects of FX translation losses on the Group’s financial statements in the most recent quarter ended June 2019 due to an increase in the active management of the Group’s foreign currency exposure.”
Fees & commissions income rose by 98%, to close at $721.60 million (2018: $364.38 million). Mananagement noted, “the fee revenues were principally driven by continued growth in the asset management business line and the effects of the introduction of the investment banking business line. The investment banking business, launched in December 2018, has generated fee income of $331.3 million up to June 2019.”
Notably, the Company reported other income of $312.19 million for the period relative to $871,000 in 2018. Management noted, “this principally resulted from the recovery of investment losses incurred by the company earlier in the year.” As such, net operating revenue amounted to $2.82 billion relative to $841.73 million recorded for the comparable period in 2018. Management highlighted, “the most significant drivers of this growth were the gains in investment activities of $1.1 billion, and fee income. Non-interest income as a percentage of net revenue, rose to 84.5% from 63.5% in the previous year which is consistent with our strategic objective of growing this revenue segment towards commanding a greater share of net revenues.” Net operating revenue for the third quarter amounted to $1.65 billion in contrast to $351.63 million booked for the third quarter of 2018.
Administrative Expenses for the period amounted to $345.81 million, increasing 28% from $270.40 million in 2018. Staff costs for the period rose 48% from $271.12 million booked in 2018 to $402.27 million. BIL reported an “Impairment/ Expected Credit Loss (ECL)” of $80.73 million (2018: nil) for the nine-month period. Total expenses for the period rose 53% to close at $828.81 million compared to $541.53 million recorded in 2018. BIL noted, “the increase was largely driven by strategic growth objectives, specifically an additional #131.1 million increase in staff costs driven by talent acquisition in support of revenue growth and diversification efforts, which were more than offset by the resulting gain; and a related rise in administrative costs associated with increased marketing efforts and facility improvements.” As, such, profit before tax amounted to $1.99 billion relative to a profit before taxation of $300.20 million in 2018.
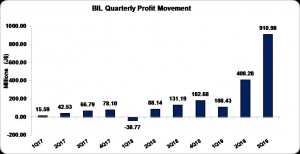
Following taxation of $559.33 million (2018: $119.64 million), the company reported net profit of $1.43 billion, relative to the profit of $180.56 million booked in 2018. Notably, this surge in net profit is due to the gain on investments activity of $1.24 billion; of which $1.03 billion was attributed to “FMV Gains on Equity Portfolio”. Net profit for the quarter amounted to $910.98 million, 594% above the $131.19 million for the corresponding quarter of 2018.
Earnings per Share (EPS) for the first quarter totalled $1.29 relative to $0.19 in 2018. EPS for the nine month period amounted to $2.02 compared to $0.25 recorded for the prior year’s period. The trailing earnings per share amounted to $2.27. The number of shares used in our calculations amounted to 708,157,308 units. BIL stock price closed the trading period on July 8, 2019 at $45.00.
Balance Sheet at a glance:
As at June 30, 2019, total assets amounted $31.08 billion (2018: $17.17 billion), a $13.91 billion improvement as a result of the growth in “Marketable Securities” which increased by 212% to a total of $10.33 billion (2018: $3.31 billion). Pledged assets also contributed to the increase in the asset base with a 48% increase to close at $11.92 billion (2018: $8.07 billion).
Shareholders’ Equity amounted to $9.27 billion relative to $3.22 billion in 2018 resulting in a book value per share of $13.09 relative to $4.55 in 2018.
Analyst Certification -The views expressed in this research report accurately reflect the personal views of Mayberry Investments Limited Research Department about those issuer (s) or securities as at the date of this report. Each research analyst (s) also certify that no part of their compensation was, is, or will be, directly or indirectly, related to the specific recommendation (s) or view (s) expressed by that research analyst in this research report.
Company Disclosure -The information contained herein has been obtained from sources believed to be reliable, however its accuracy and completeness cannot be guaranteed. You are hereby notified that any disclosure, copying, distribution or taking any action in reliance on the contents of this information is strictly prohibited and may be unlawful. Mayberry may effect transactions or have positions in securities mentioned herein. In addition, employees of Mayberry may have positions and effect transactions in the securities mentioned herein.


