
Date: December 6, 2018
Blue Power Group Limited (BPOW), for the six months ended October 31, 2018 booked a 13% increase in revenue to total $862.31 million compared to $761.19 million for the corresponding period in 2017. Sales from the Lumber division climbed to $591.91 million, 9% higher than $544.35 million, while sales in the Soap division soared to $270.40 million relative to $216.84 million a year ago, by 25% . Revenue for the quarter totalled $425.86 million, 12% above last year’s corresponding quarter of $380.65 million. BPOW highlighted, “The overall strong increase in sales for this quarter was however reduced by net finance cost which was $9.5 million compared to $2.7 million for the same period last year.”
The company mentioned, “Export sales continue to record improved performance. During the period under review, over 24% of our soap sales went to export markets in the Caribbean, the USA and the UK. Sales in the Caribbean market continue to be brisk as greater interest, acceptance and satisfaction of our product range materialize.”
Cost of sales for the period showed an increase of 11%, moving from $595.59 million to $658.43 million. This further translated into gross profit amounting to $203.88 million, an increase of 23% when compared to $165.60 million in 2017. Gross profit for the second quarter moved up 29% to close at $100.13 million (2017: $77.51 million).
Administrative expenses saw an increase of 15%, to total $119.28 million (2017: $103.45 million). Thus resulting in profit from operations of $84.60 million, 36% more than 2017’s $62.14 million. For the second quarter profit from operations saw an 82% jump to $39.14 million versus $21.46 million in 2017.
Other income, for the period totalled $446, 242 a significant decline when compared to the $1.78 million recorded for the same period last year.
In addition, finance costs of $3.01 million were recorded for the period, a 60% decline when compared to $7.62 million in the year prior. Finance income rose to $16.44 million relative to $7.33 million in the corresponding period in 2017, by 124%.
Profit before tax totalled $98.46 million compared to $63.63 million in 2017 followed by tax charges of $11.68 million (2017: $7.62 million).
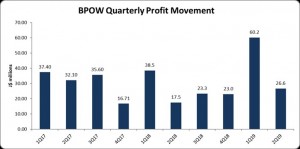
Net Profit for the period totalled $86.78 million, a 55% decrease compared to $56 million the prior financial year, while net profit for the quarter amounted to $26.58 million (2017:$17.53 million).
Earnings per share (EPS) for the period totalled $0.154 (2017: $0.099). EPS for the second quarter amounted to $0.047 relative to $0.031. The twelve-month trailing EPS is $0.24. The number of share used in our calculations amounted to 564,990,000 units. BPOW’s stock price close the trading period on December 6, 2017 at $5.45.
Additionally, BPOW noted, “The soap business has a range of local and international competitors and the business continues to strengthen its product range and operating efficiency to remain highly competitive. The indicators for continued development of the local economy is a positive factor to pursue development in both divisions to maximize financial returns. The construction sector is still robust and our store at Papine enjoys strong customer interaction despite space limitations.”
Balance Sheet at a glance:
As at October 31, 2018, total assets amounted to $970.45million, up $163.38 million from the balance of $807.06 million as at October 31, 2017. The increase in total assets was as a result of the increase in investments which closed the period at $153.60 million (2017: nil).
Shareholders’ Equity of $838.78 million was reported (2017: $716.50 million) which resulted in a book value per share of $1.49 (2017: $1.27).
Disclaimer: Analyst Certification -The views expressed in this research report accurately reflect the personal views of Mayberry Investments Limited Research Department about those issuer (s) or securities as at the date of this report. Each research analyst (s) also certify that no part of their compensation was, is, or will be, directly or indirectly, related to the specific recommendation (s) or view (s) expressed by that research analyst in this research report.
Company Disclosure -The information contained herein has been obtained from sources believed to be reliable, however its accuracy and completeness cannot be guaranteed. You are hereby notified that any disclosure, copying, distribution or taking any action in reliance on the contents of this information is strictly prohibited and may be unlawful. Mayberry may effect transactions or have positions in securities mentioned herein. In addition, employees of Mayberry may have positions and effect transactions in the securities mentioned herein.


