
September 17, 2020
CAC 2000 Limited’s (CAC) ‘Revenues’ for the nine months ended July 31, 2020 increased 26% to $928.23 million relative to $737.69 million for the comparable period in 2019. ‘Revenues’ for the third quarter increased by 60% to $354.68 million compared to $221.21 million for the same period the prior financial year.
‘Cost of Sales’ also increased by 22% for the period to $609.26 million (2019: $498.50 million). Consequently, ‘Gross Profit’ for the period improved $76.79 million or 33% to $318.98 million (2019: $239.19 million) when compared to 2019 corresponding period. For the quarter, ‘Gross Profit’ climbed 74% to close at $114.36 million (2019: $65.54 million).
The Company reported a 4% decrease in ‘Total Expenses’ to $295.53 million (2019: $306.70 million). This was as a result of a 5% decrease in ‘General Administration’ to $276.61 million (2019: $290.93 million), however, moderated by a 20% upward movement in ‘Selling & Distribution Expenses’ to $18.92 million (2019: $15.77 million). For the quarter, the Company reported a 21% decrease in ‘Total Expenses’ which closed at $81.27 million compared to $102.54 million in 2019.
CAC noted, “we introduced a work from home/rostering system and reduced costs as much as possible without having to lay off any employees. We continue to take the opportunity to reexamine our historical business model and improve our operational efficiencies, change our approach and find creative ways to reduce our operational expenses and improve productivity ratios.”
‘Other Income’ of $2.36 million was recorded for the period down from $47.20 million reported for the same period the prior year. ‘Profit before Taxation and Finance Cost’ amounted to $25.81 million, versus a loss of $20.31 million booked in 2019.
‘Net Finance Costs’ decreased 3% for the period in review to $18.57 million from $19.16 million recorded twelve months earlier. As a result of; ‘Interest Expense’ and ‘Interest Income’ for the nine months amounting to $22.18 million relative to $17.56 million in 2019 and $263,085 relative to $206,761, respectively.
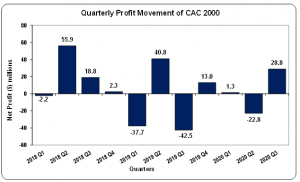
‘Profit Before Taxation’ for the nine months closed at $7.24 million relative to a loss of $39.47 million booked in 2019. No taxes were recorded for the period, as such, ‘Net Profit’ for the nine months closed at $7.24 million versus a loss of $39.47 million booked in 2019. ‘Net Profit’ for the quarter was reported at $28.77 million compared to a loss of $42.54 million for the corresponding quarter of 2019.
Earnings-per-share (EPS) for the nine months amounted to $0.06 compared to a loss per share (LPS) of $0.31 in 2019, while for the quarter the EPS amounted to $0.22 versus a LPS of $0.33. The twelve months trailing EPS amounted to $0.16. The number of shares used in our calculations is 129,032,258 units. Notably, CAC’s stock price closed the trading period on September 16, 2020 at a price of $11.90.
CAC stated that, “we have been aggressively working with suppliers and customers to design and rapidly execute IEQ solutions and we are happy to state that we have been making major inroads while helping customers to minimize downtime of their operations (as being announced daily). This impetus is expected to spill over to Q4 and 2021 and we continue to refine our offerings.”
Balance Sheet Highlights:
As at July 31, 2020, the Company reported total assets of $1.21 billion, a 9% increase when compared to $1.11 billion a year ago. This was as a result ‘Trade and Other Receivables’ which increased 23% to $643.32 million (2019: $521.72 million). The Company highlighted that, “we continue to work on driving down inventory, but cash inflows are down due to processing delays and hence accounts receivables and borrowings have temporarily trended upwards.”
Shareholders’ Equity as at July 31, 2020 was $374.19 million compared to $443.55 million a year ago. This resulted in a book value per share of $2.90 compared to $3.44 recorded in 2019.
Disclaimer:
Analyst Certification -The views expressed in this research report accurately reflect the personal views of Mayberry Investments Limited Research Department about those issuer (s) or securities as at the date of this report. Each research analyst (s) also certify that no part of their compensation was, is, or will be, directly or indirectly, related to the specific recommendation(s) or view (s) expressed by that research analyst in this research report.
Company Disclosure -The information contained herein has been obtained from sources believed to be reliable, however its accuracy and completeness cannot be guaranteed. You are hereby notified that any disclosure, copying, distribution or taking any action in reliance on the contents of this information is strictly prohibited and may be unlawful. Mayberry may effect transactions or have positions in securities mentioned herein. In addition, employees of Mayberry may have positions and effect transactions in the securities mentioned herein.


