
June 14, 2022
CAC 2000 (CAC), for the six months ended April 30, 2022, reported revenues of $535.67 million versus $508.52 million booked in 2021. Revenues for the quarter grew by 23% to $313.43 million (2021: $255.19 million).
Cost of sales fell by 1% for the six months period to $299.35 million (2021: $301.03 million). Consequently, gross profit for the period increased by 14% closing at $236.31 million compared to $207.48 million for the same period last year. For the quarter, gross profit increased 75% to $165 million (2021: $94.21 million).
The Company reported a 12% increase in total expenses to $211.88 million (2021: $190 million). There was a 14% expansion in General Administration to $204.11 million (2021: $178.59 million). While, Selling and Distribution amounted to $7.77 million (2021: $11.42 million). For the quarter, the Company reported a 25% increase in total expenses which closed the quarter at $116.44 million (2021: $93.35 million).
Other income of $1.3 million was recorded for the period under review, up from $40,000 reported for the same period in the prior year.
Profit before taxation and finance cost, for the six months ended April 30, 2022, amounted to $25.73 million relative to a gain of $17.52 million in 2021.
Net finance costs ended at $12.40 million (2021: $12.25 million). Of this, interest expense for the six months amounted to $16.45 million (2021: $13.39 million). Interest income closed at $27,269 (2021: $21,800) whereas other gains closed at $4.02 million versus other gains of $1.12 million reported in the same period last year.
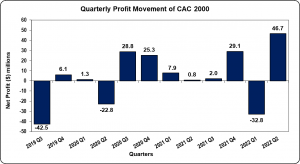
Profit before taxation for the six months amounted to $13.33 million relative to $5.27 million in 2021. Taxation credit amounted to $468,798, as such net profit totaled $13.80 million relative to $8.70 million in 2021. Net profit for the quarter was reported at $46.69 million compared to $766,016 booked in the corresponding quarter of 2021.
Earnings per share (EPS) for the six months amounted to $0.11 compared to $0.07 in 2021, while for the quarter EPS amounted to $0.36 versus $0.01 documented in the prior comparable quarter. The twelve months trailing EPS amounted to $0.35. The number of shares used in our calculations is 129,032,258 units. Notably, CAC’s stock price closed the trading period on June 10, 2022 at a price of $7.00 with a corresponding P/E ratio of 20.12 times.
Management noted, “Supply chain issues continue to present a challenge with delays, and price increases however we are better managing this new norm. We are also happy to report an uptick in our service business as most companies start to return to regular working days, along with the cessation of lockdowns.”
Furthermore, CAC noted that, “Enervate continues to make inroad in the market with many proposals out there for consideration, with its proof-of-concept commercial solar project expected to start at CAC on or before July1, 2022. Water conservation efforts in place at CAC have already reduced our Q1 NWC costs by 16%.”
Balance Sheet at a glance:
As at April 30, 2022, the Company reported total assets of $1.58 billion, a 38% increase when compared to $1.15 billion a year ago. This was as a result of ‘Trade and Other Receivables’ and ‘Inventories’ which closed at $743.31 million (2021: $658.47 million) and $608.60 million (2021: $326.64 million), respectively. This was however tempered by a downward movement in ‘Cash and Cash Equivalents” which amounted to $99.53 million (2021: $119.01 million). Management noted that, “Trade receivable increased by 12.9% over the same period last year, which is attributed to the reopening of many of our projects and service sites, as well as finally getting to book invoices for services etc. which had been put on hold during Covid.”
Shareholders’ Equity as at April 30, 2022 was $437.43 million compared to $397.05 million a year ago. This resulted in a book value per share of $3.39 compared to $3.08 in 2021.
Disclaimer:
Analyst Certification -The views expressed in this research report accurately reflect the personal views of Mayberry Investments Limited Research Department about those issuer (s) or securities as at the date of this report. Each research analyst (s) also certify that no part of their compensation was, is, or will be, directly or indirectly, related to the specific recommendation(s) or view (s) expressed by that research analyst in this research report.
Company Disclosure -The information contained herein has been obtained from sources believed to be reliable, however its accuracy and completeness cannot be guaranteed. You are hereby notified that any disclosure, copying, distribution or taking any action in reliance on the contents of this information is strictly prohibited and may be unlawful. Mayberry may effect transactions or have positions in securities mentioned herein. In addition, employees of Mayberry may have positions and effect transactions in the securities mentioned herein.


