February 13, 2018
Caribbean Cement Company Limited (CCC) ,for the for the year ended December 31, 2017 reported total revenue for the year ended December 31, 2017 of $16.51 billion, a 5% or $732.3 million increase when compared with the $15.78 billion reported in 2016. Total revenue for the quarter amounted to $4.25 billion reflecting an increase of 11.9% over the $3.80 billion achieved in the corresponding quarter.
Earnings before interest, tax, depreciation & amortization (EBITDA) amounted to $3.03 billion, an increase of 12% relative to $2.70 billion for the prior year’s corresponding period. For the quarter, CCC reported EBITDA of $598.02 million, $363.72 million more than that reported in 2016 (2016: $234.3 million). CCC noted, “This performance was driven mainly by lower operating expenses as the restructuring and efficiency improvement programs executed took full effect.”
Depreciation and amortization closed the year end at $531.60 million (2016: $495.69 million). CCC reported Stockholding and inventory restructuring loss of $457.82 million compared to the loss of $400.77 million reported in 2016. Manpower Restructuring Cost of $416.85 million was reported for the 2017 year end compared to $406.12 million reported in 2016. As such, operating profit for the year amounted to $1.62 billion relative to $1.40 billion booked in 2016.
Interest Income for 2017 financial year end amounted to $5.10 million, a 2% decline compared to $5.20 million for the corresponding period in 2016.
Notably, the company reported $67.87 million for finance cost compared to a $54.59 million reported in 2016.
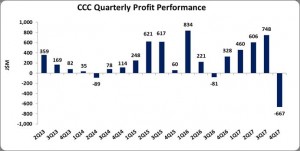
Profit before taxation for the year end amounted to $1.56 billion, a 15% increase when compared with the $1.35 billion recorded for the 2016 year end. Taxation for the period amounted to $410.57 million, a vast increase of 735% when compared with the $49.16 million reported in 2016. As such, Net profit for the 2017 financial year closed at $1.15 billion, a 12% decline relative to net profit of $1.30 million reported during the corresponding period in 2016. Net loss for the quarter amounted to $666.62 million compared to a profit of $328.35 million for the corresponding quarter of 2016.
Total comprehensive income attributable to shareholders for the period amounted to $1.22 billion compared to $1.30 billion for the corresponding period in 2016.
Consequently, earnings per share (EPS) amounted to $1.43 (2016: $1.53), while the loss per share for the quarter was $0.78 (2016: EPS of $0.39). The twelve months trailing EPS is $1.35. The number of shares used in this calculation was 851,136,591 shares. Notably, the stock price for CCC closed the trading period on February 12, 2017 at $32.71.
CCC highlighted, “during Q4-2017 the Company incurred significant restructuring costs of $875 million, which will allow for the development of a more competitive and flexible cost structure and increase the profitability of the plant going forward.” They also noted they incurred, “significant increases in energy and fuel related expenses”.
Additionally, CCC noted, “2017 was a transition year for Carib Cement, the most significant achievement being that Health and Safety practices are now the company’s top priority and an integral part of the culture of the Carib Cement family. Our workforce development programs were also a significant feature of 2017, and more than 2,000 hours of training was completed, including cross-training within business units across the CEMEX Group. On the Customer side, focus continued on three priorities: placing our customers’ needs at the center of our work philosophy, making it easier to do business with us, and making customer centricity a discipline. The Net Promoted Score (NPS) indicator system was launched, which will allow us to keep track of customer feedback on our performance and therefore fuel constant improvement in the product offering as well as customer service.”
Balance sheet at a Glance:
Total Assets as at December 31, 2017 amounted to $12.21 billion (2016: $10.42 billion), an increase of 17%. The increase in total assets was largely due to the increase in property, plant and equipment which grew by $1.71 billion to a total of $8.28 billion (2016: $6.57 billion). Cash and cash equivalents also contributed to the over growth with a $955.50 million increase to $1.67 billion (2016: $717.57 million).
Shareholder’s equity totaled $8.96 billion compared to the $7.74 billion quoted as at December 31, 2016. This resulted in a book value of $10.53 (2016: $9.09). The number of shares used in our calculations amounted to 851,136,591 units.
The information contained herein has been obtained from sources believed to be reliable, however its accuracy and completeness cannot be guaranteed. You are hereby notified that any disclosure, copying, distribution or taking any action in reliance on the contents of this information is strictly prohibited and may be unlawful. Mayberry may effect transactions or have positions in securities mentioned herein. In addition, employees of Mayberry may have positions and effect transactions in the securities mentioned herein.


