
July 30, 2024
Caribbean Cement Company Ltd (CCC) for the six months ended June 30, 2024, reported a 7% increase in revenues totaling $15.28 billion compared to $14.28 billion in the corresponding period last year. Revenues for the second quarter had a 3% increase to close at $7.67 billion compared to $7.48 billion for the comparable quarter of 2023.
Cost of sales amounted to $7.79 billion (2023: $9.29 billion), this represents a decline of 16% year over year. Consequently, gross profit increased by 50% to $7.50 billion compared to $4.99 billion for the six months ended June 30, 2023. The company booked gross profit of $3.89 billion for the second quarter versus $3.68 billion reported for the similar quarter of 2023.
Operating Expenses increase by 5% to close at $1.45 billion (2023: $1.39 billion).
Operating profit for the six months amounted to $5.39 billion, a 68% increase relative to $3.20 billion reported in 2023. Operating profit for the second quarter amounted to $2.76 billion (2023: $2.88 billion).
Profit before taxation for the six months amounted to $5.43 billion, a 77% increase relative to $3.07 billion reported in 2023. Profit before taxation for the second quarter amounted to $2.80 billion (2023: $2.91 billion). CCC noted, “The improvement in “Earnings before taxation” for the first six months was primarily due to normalised operations, as the prior period incurred significantly higher costs from scheduled annual maintenance in the first quarter of 2023.”
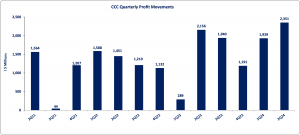
Taxation for the six months was $1.15 billion (2023: $624.56 million). Net Profit for the six months amounted to $4.28 billion, a 75% increase from the $2.45 billion reported in 2023. For the second quarter, Net Profit was $2.35 billion (2023: $2.16 billion).
Consequently, Earnings Per Share for the six months amounted to $5.03 (2023: EPS: $2.87), while Earnings Per Share for the quarter totaled $2.76 (2023: EPS: $2.53). The twelve-month trailing EPS was $8.71, and the number of shares used in these calculations was 851,136,591.
Notably, CCC’s stock price closed the trading period on July 29, 2024, at a price of $64.50 with a corresponding P/E ratio of 7.41x.
Balance Sheet Highlights
The company’s assets totalled $39.60 billion (2023: $31.49 billion). This resulted from a 257% jump in ‘cash and cash equivalents’ closing at $9.46 billion. Management highlighted that this includes a highly liquid, deposit investment account in CEMEX Innovation Holding Limited amounting to J$8.7 billion (US$56.0 million).
Shareholder’s equity was $28.39 billion (2023: $22.43 billion), representing a book value per share of $33.36 (2023: $26.36).
Disclaimer:
Analyst Certification -The views expressed in this research report accurately reflect the personal views of Mayberry Investments Limited Research Department about those issuer (s) or securities as at the date of this report. Each research analyst (s) also certify that no part of their compensation was, is, or will be, directly or indirectly, related to the specific recommendation(s) or view (s) expressed by that research analyst in this research report.
Company Disclosure -The information contained herein has been obtained from sources believed to be reliable, however its accuracy and completeness cannot be guaranteed. You are hereby notified that any disclosure, copying, distribution or taking any action in reliance on the contents of this information is strictly prohibited and may be unlawful. Mayberry may effect transactions or have positions in securities mentioned herein. In addition, employees of Mayberry may have positions and effect transactions in the securities mentioned herein


