May 13, 2022
Everything Fresh (EFRESH) for the three months ended March 31, 2022 reported total revenue of $534.25 million, a 173% increase from the $195.57 million reported in Q1 2021. Cost of Sales for the three-month period grew 182% to $426.24 million relative to the $151.11 million booked the corresponding period in 2021.
Owing to the mammoth growth in top-line revenue, Gross Profit for the period amounted to $108.01 million, growing by 143% from the $44.60 million reported in Q1 2021.
The Company reported ‘other operating income’ of $2.72 million for the period, $1.97 million more than the million reported in Q1 2021.
Total operating expenses in Q1 rose by $28.31 million or 43% to $94.82 million compared to $66.51 million booked for the corresponding period in 2021. Of this, Administrative Expenses rose by $25.73 million to $90.51 million (2021: $64.77 million), while Selling and Promotion Expenses advanced to $4.32 million (2021: $1.74 million). After deducting operating expenses, EFRESH had an operating profit of $15.90 million in their first quarter (2021: $22.31 million).
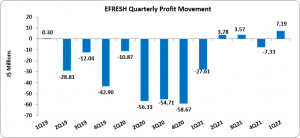
After finance costs of $8.71 million (2021: $5.29 million), EFRESH posted Q1 profit before tax of $7.19 million (2021: -$27.60 million)
No taxes were incurred for the period in review or the period prior.
Consequently, Earnings per share (EPS) for the period amounted to $0.009 (LPS 2021: $0.035). The trailing twelve months EPS is $0.009. The total amount of shares outstanding used for this calculation was 780,000,000 units. Notably, EFRESH closed the trading period on May 12, 2022 at a price of $1.69, with a corresponding PE ratio of 175.33 times.
Balance Sheet at a glance:
As at March 31, 2022, total assets amounted to $967.34 million, 36% more than the $709.96 million in Q1 2021. This was attributable to a $82.36 million increase in ‘Intangible Assets’ to $85.41 million (2021: $3.05 million) a $54.80 million increase in ‘Cash & Cash Equivalents’ and a $119.48 million increase in ‘Trade Receivables’ which amounted to $275.76 million (2021: $156.28 million).
Shareholder’s Equity totalled $329.75 million versus $331.02 million as at March 31, 2021. This resulted in a book value per share of approximately $0.423 compared to $0.424 in 2021.
Disclaimer:
Analyst Certification -The views expressed in this research report accurately reflect the personal views of Mayberry Investments Limited Research Department about those issuer (s) or securities as at the date of this report. Each research analyst (s) also certify that no part of their compensation was, is, or will be, directly or indirectly, related to the specific recommendation (s) or view (s) expressed by that research analyst in this research report.
Company Disclosure -The information contained herein has been obtained from sources believed to be reliable, however its accuracy and completeness cannot be guaranteed. You are hereby notified that any disclosure, copying, distribution or taking any action in reliance on the contents of this information is strictly prohibited and may be unlawful. Mayberry may effect transactions or have positions in securities mentioned herein. In addition, employees of Mayberry may have positions and effect transactions in the securities mentioned herein.