
Date: February 14, 2019
Elite Diagnostic Limited booked a 29% increase in revenue to total $182.24 million compared to $141.67 million for the same period in 2017. Revenue for the 2nd quarter rose by 35% to $96.76 million (2017: 71.85 million). Management noted, “The increase in revenue for the 2nd quarter is due to MRI scans and increase in Intervention procedures”
Direct costs for the period increased 26%, closing at $58.55 million, up from $46.48 million reported the prior year, while for the second quarter there was a 25% increase closing at $30.98 million (2017: $24.75 million).
As such, gross profit for the six months amounted to $123.70 million, a growth of 30% when compared to $95.19 million recorded last year. Gross profit for the second quarter increased 40% from $47.11 million to $65.78 million for the corresponding period in 2017.
Administrative expenses climbed by 50% for the period, to total $78.88 million (2017: $52.54 million). Depreciation and amortization also increased by 64% to total $26.70 million relative to the $16.31 booked in 2017. This resulted in profit from operations of $18.12 million, a 31% decrease relative to $26.34 million booked a year ago.
Finance Cost for the six months totalled $9.53 million, a decrease of 9% when compared to the $10.44 million recorded for the same period last year, while foreign loss amounted to $1.81 relative to nil the prior year.
Profit before tax totalled $6.79 million compared to $15.91 million recorded last year, a 57% reduction year over year.
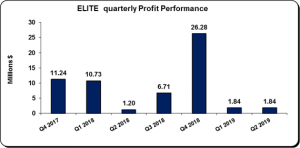
Following no income tax for the period (2017: $3.98 million), Net Profit for the year totalled $6.79 million relative to $11.93 million recorded the prior financial year. Net profit for the quarter amounted to $4.95 million, a 313% increase compared to $1.20 million booked for the prior quarter of 2017. According to the company, “The decrease in net profit for the 6 months was due mainly to the increase in expenses over income incurred at the newly opened Liguanea location.”
Earnings per share (EPS) for the period totalled $0.02 (2017: $0.03). EPS for the fourth quarter amounted to $0.014 (2016: $0.003). The trailing twelve-month EPS amounted to $0.11. The number of shares used in our calculations amounted to 353,400,000 units. ELITE’s stock price closed the trading period on February 14th 2018, at $3.14.
ELITE stated, “The company continues its revenue growth at the new Liguanea location. MRI scans continue to be robust and Ultrasounds are steadily growing. With the addition of several doctors, the company is expecting a substantial revenue increase from its Interventional procedures for the calendar year 2019”. The Company also noted that, “The construction of the new St Ann location is underway and the expected opening is 1st Quarter next year. This location intends to offer MRI, CT, Ultrasound and X-Ray along with doctors’ offices.” Management also note, “The construction of the new St Ann location is underway and the expected opening is 1st Quarter next year. This location intends to offer MRI, CT, Ultrasound and X-Ray along with doctors’ offices. With the St Ann location due to open in the next 6 months, and the continued growth of the Liguanea location, we think the future seems very promising for Elite Diagnostic.”
Balance Sheet at a glance:
As at December 31, 2018, total assets amounted to 538.94 million, up $134.02 million from the balance of $449.92 million as at the previous year. The increase in total assets was as a result of the increase in ‘Property, Plant and Equipment’ from $389.34 million to $493.3 million.
Shareholders’ Equity of $406.28 million was reported (2017: $235.46 million) which resulted in a book value per share of $1.15 (2017: $0.67).
Disclaimer:
Analyst Certification -This research report is for information purposes only and should not be construed as a recommendation. Each research analyst (s) also certify that no part of their compensation was, is, or will be, directly or indirectly, related to the specific recommendation (s) or view (s) expressed by that research analyst in this research report.
Company Disclosure -The information contained herein has been obtained from sources believed to be reliable, however its accuracy and completeness cannot be guaranteed. You are hereby notified that any disclosure, copying, distribution or taking any action in reliance on the contents of this information is strictly prohibited and may be unlawful. Mayberry may affect transactions or have positions in securities mentioned herein. In addition, employees of Mayberry may have positions and effect transactions in the securities mentioned herein.


