April 3, 2023
Net interest income increased 37% to $137.97 million (2021: $100.94 million). For the quarter, net interest income increased 39% to $26.04 million (2021: $18.77 million).
Asset management income increased 29% to $283.34 million (2021: $219.11 million). For the quarter, asset management income increased 94% to $80.14 million (2021: $41.37 million).
Other operating income declined 35% to $91.48 million (2021: $140 million). For the quarter, other operating income declined 36% to $50.94 million (2021: $79.53 million).
Administrative expenses increased 15% to $243 million (2021: $211.69 million). For the quarter, administrative expenses increased 18% to $74.67 million (2021: $63.09 million).
Net impairment of financial and contract assets increased 97% to $2.90 million (2021: $1.47 million). For the quarter, net impairment of financial and contract assets increased 53% to $2.78 million (2021: $1.81 million).
Share of net profit from joint venture declined 86% to $2.94 million (2021: $21.58 million). For the quarter, share of net loss from joint venture declined 61% to $59,000 (2021: $153,000).
Profit before taxation increased 1% to $269.84 million (2021: $268.47 million). For the quarter, profit before taxation increased 7% to $79.61 million (2021: $74.61 million).
Taxation charges increased 84% to $31.05 million (2021: $16.83 million). For the quarter, taxation charges soared to $28.96 million (2021: $893,000).
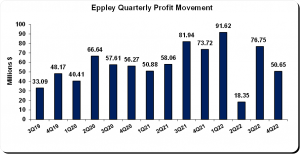
Net profit declined 5% to $238.80 million (2021: $251.63 million). For the quarter, net profit declined 31% to $50.65 million (2021: $73.72 million).
Total comprehensive income declined 10% to $240.53 million (2021: $266.09 million). For the quarter, total comprehensive income declined 41% to $50.34 million (2021: $84.67 million).
Earnings per share (EPS) amounted to $1.24 (2021: $1.31). For the quarter, EPS amounted to $0.26 (2021: $0.38). The total amount of shares outstanding used for this calculation was 192,468,300 units. EPLY last traded at $37.00 on April 3, 2023 with a corresponding P/E ratio of 29.82 times.
Balance Sheet Highlights:
Total assets as at December 31, 2022 amounted to $5.61 billion (2021: $5.52 billion), an increase of 2% year over year. This is primarily attributed to a 56% increase in ‘Cash and Deposits’ to $1.03 billion (2021: $661.40 million).
Shareholder’s Equity as at December 31, 2022 increased 1% to $1.10 billion (2021: $1.09 billion). This resulted in a book value per share of approximately $5.69 (2021: $5.66).
Disclaimer:
Analyst Certification – The views expressed in this research report accurately reflect the personal views of Mayberry Investments Limited Research Department about those issuer (s) or securities as at the date of this report. Each research analyst (s) also certify that no part of their compensation was, is, or will be, directly or indirectly, related to the specific recommendation(s) or view (s) expressed by that research analyst in this research report.
Company Disclosure – The information contained herein has been obtained from sources believed to be reliable, however its accuracy and completeness cannot be guaranteed. You are hereby notified that any disclosure, copying, distribution or taking any action in reliance on the contents of this information is strictly prohibited and may be unlawful. Mayberry may effect transactions or have positions in securities mentioned herein. In addition, employees of Mayberry may have positions and effect transactions in the securities mentioned herein.