January 13, 2022
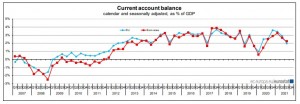
According to Eurostat’s recent report, the EU third quarter of 2021, seasonally adjusted current account balance recorded a surplus of €72.1 billion, which is 2.0% of GDP. This represents a decrease of €31 billion, from the second quarter surplus of €103.1 billion, which was 2.9% of the GDP. Also, €16 billion less than 2020 third quarter current account surplus of €88.1 billion which was 2.6% of GDP.
Eurostat noted, “in the third quarter of 2021 compared with the second quarter of 2021, based on seasonally adjusted data, the surplus of the goods account decreased (+€53.4 bn compared to +€76.2 bn), while the surplus of the services account increased (+€29.7 bn compared to +€25.3 bn).” The statistical office also stated that, “the surplus of the primary income account decreased (+€5.7 bn compared to +€21.2 bn), as did the deficit of the secondary income account (-€16.7 bn compared to -€19.7 bn).” The surplus of the capital account rose by €1.2 billion, compared to €0.3 billion booked in the second quarter.
The Eurostat further presented the non-seasonally adjusted data for the third quarter external current account surpluses with the “United Kingdom (+€59.7 bn), the USA (+€32.6 bn), Switzerland (+€23.7 bn), Brazil (+€5.6 bn), Hong Kong (+€5.2 bn), Canada (+€4.7 bn), Japan (+€1.0 bn) and India (+€0.6 bn). Deficits were registered with China (-€36.5 bn), Russia (-€9.2 bn) and offshore financial centres (-€3.1 bn).”
Based on non-seasonally adjusted data, direct investment assets of the EU increased in the third quarter of 2021 by €28.3 billion, while direct investment liabilities declined by €73.5 billion. As a result, the EU was a net direct investor to the rest of the world in the third quarter of 2021 by €101.8 billion. Portfolio investment recorded a net outflow of €12.8 billion and for other investment there was a net inflow of €210.0 billion.
Disclaimer:
Analyst Certification -The views expressed in this research report accurately reflect the personal views of Mayberry Investments Limited Research Department about those issuer(s) or securities as at the date of this report. Each research analyst (s) also certify that no part of their compensation was, is, or will be, directly or indirectly, related to the specific recommendation(s) or view(s) expressed by that research analyst in this research report.
Company Disclosure -The information contained herein has been obtained from sources believed to be reliable, however its accuracy and completeness cannot be guaranteed. You are hereby notified that any disclosure, copying, distribution or taking any action in reliance on the contents of this information is strictly prohibited and may be unlawful. Mayberry may effect transactions or have positions in securities mentioned herein. In addition, employees of Mayberry may have positions and effect transactions in the securities mentioned herein.