Brent Oil
Brent oil prices increased by 5.02 % or US$3.43, as prices rose this week. Oil traded on April 12, 2018 at a price of $71.76 per barrel relative to US$68.33 last week. Brent oil began the year at US$68.07 per barrel.
Petrojam prices
87 Octane prices decrease week over week, by 0.31% (JMD$0.38). Additionally 90 Octane fell by 0.30% or (JMD$0.38) week over week. 87 Octane and 90 Octane opened the year at J$121.04 and J$123.88 respectively and now trades at J$123.41 and J$126.25 per litre respectively.
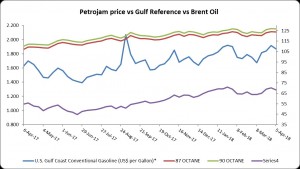
Figure 1: Petrojam, U.S. Gulf Coast Conventional Gasoline Regular and Brent Crude Oil 1 Year Price History
This Week in Petroleum
Retail gasoline prices this summer are expected to be 11% higher than in summer 2017
The US Energy Information Administration (EIA) reported that regular gasoline for this summer has seen a 11% increase as compared to last summer causing drivers within the United States to pay an average of $2.74 per gallon. The EIA has forecasted the upcoming summer which ranges from April through September that prices will increase by 26 cents greater than the average of last year but will still be lower than last four year’s summer average by 15 cents. The movement in price this summer mainly reflects higher projected crude oil prices than that of last year. Monthly average gasoline prices are expected to be the same for majority of the summer (avg: $2.78/gal) and reducing to $2.65/gal in September.
EIA forecasts that for the year 2018 US regular gasoline prices will average at $2.64/gal. Based on this, it is expected that the average household will spend about $190 (4.7%) more om gasoline this year than in 2017. However, they will spend about $130(2.9%) less than in 2014, when retail gasoline prices average more than $3.00/gal. Crude oil prices, wholesale margins, retail distribution costs, and taxes constitutes to how gas is priced. Changes in gasoline prices have been primarily because of movement in crude oil prices and wholesale margins as the taxes and retail distribution costs are generally stable. As the dollar per barrel of sustained price change in crude oil and wholsesale margins move, this caused an average 2.4-cent-per-gallon change in product prices.
For additional information click the link below:
Disclaimer:
Analyst Certification -The views expressed in this research report accurately reflect the personal views of Mayberry Investments Limited Research Department about those issuer (s) or securities as at the date of this report. Each research analyst (s) also certify that no part of their compensation was, is, or will be, directly or indirectly, related to the specific recommendation (s) or view (s) expressed by that research analyst in this research report.
Company Disclosure -The information contained herein has been obtained from sources believed to be reliable, however its accuracy and completeness cannot be guaranteed. You are hereby notified that any disclosure, copying, distribution or taking any action in reliance on the contents of this information is strictly prohibited and may be unlawful. Mayberry may effect transactions or have positions in securities mentioned herein. In addition, employees of Mayberry may have positions and effect transactions in the securities mentioned herein.


