
Brent Oil
Brent oil prices decreased by 1.86 % or US$1.47, as prices fell this week. Oil traded on May 31, 2018 at a price of $77.72 per barrel relative to US$79.19 last week. Brent oil began the year at US$68.07 per barrel.
Petrojam prices
87 Octane prices increased week over week, by 0.25% (JMD$0.33). Additionally 90 Octane rosel by 0.24% or (JMD$0.33) week over week. 87 Octane and 90 Octane opened the year at J$121.04 and J$123.88 respectively and now trades at J$132.95 and J$135.79 per litre respectively.
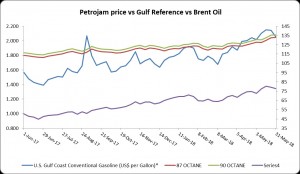
Figure 1: Petrojam, U.S. Gulf Coast Conventional Gasoline Regular and Brent Crude Oil 1 Year Price History
This Week in Petroleum
Tracked U.S. oil production statistics and trends reported by EIA
“The Energy Information Administration (EIA) persists to keep abreast of U.S. crude oil production trends as crude oil prices and rig counts rise moderately over the last few months. There are publications by EIA that speaks of the crude oil production environment and the impact of recent trends on a short-term basis for the oil industry. The products are unique in purpose, methodology, time frame and regional coverage. Some of the publications focus on approximates of current production volumes while others on the future.”
“The Petroleoum Supply Monlthy reports estimates of crude oil and petroleum products data, including production, imports and exports, movements, and inventories at national and regional levels, for the reporting period ending two months before the report is released. PSM estimates of crude oil production rely on data collected on the Form EIA-914, Monthly Crude Oil and Lease Condensate, and Natural Gas Production Report, and are considered the most definitive estimate of recent crude oil production volumes since respondents have more time to collect and provide their survey-based reports to EIA.”
“The Form EIA-914, which collects data from a sample of well operators (i.e., oil and natural gas companies) in 15 states and the Federal Offshore Gulf of Mexico (GOM), represents more than 90% of crude oil production in the United States. EIA relies on data from state and other federal agencies to estimate crude oil production for the remaining states that are not collected on the Form EIA-914. According to PSM data, U.S. crude oil production averaged more than 10 million barrels per day (b/d) from November 2017 through February 2018 (the latest data available). March data will be released on Thursday, May 31.”
For additional information click the link below:
Disclaimer:
Analyst Certification -The views expressed in this research report accurately reflect the personal views of Mayberry Investments Limited Research Department about those issuer (s) or securities as at the date of this report. Each research analyst (s) also certify that no part of their compensation was, is, or will be, directly or indirectly, related to the specific recommendation (s) or view (s) expressed by that research analyst in this research report.
Company Disclosure -The information contained herein has been obtained from sources believed to be reliable, however its accuracy and completeness cannot be guaranteed. You are hereby notified that any disclosure, copying, distribution or taking any action in reliance on the contents of this information is strictly prohibited and may be unlawful. Mayberry may effect transactions or have positions in securities mentioned herein. In addition, employees of Mayberry may have positions and effect transactions in the securities mentioned herein.


