
November 10, 2022
Grace Kennedy Limited (GK) recorded total revenue of $107.44 billion for period (2021: $95.78 billion), a year over year increase of 12%. Of this, Revenue from products and services amounted to $103.99 billion (2021: $92.36 billion) and interest revenue totalled $3.45 billion (2021: $3.42 billion).
The biggest contributor to the Group’s overall revenue for the nine-month period came from the ‘Food Trading’ segment which contributed a total of $85.66 billion (2021: $75.15 billion), an increase of 14% relative to the prior year’s corresponding period. The other segments contributing to revenue are as follows:
‘Banking & Investments’ went up 19% year over year to total $5.91 billion (2021: $4.96 billion).
Revenue from ‘Insurance’ amounted to $10.34 billion, a year over year increase of 22% over last year’s corresponding period of $8.45 billion.
‘Money Services’ brought in $6.65 billion, 8% less than the $7.22 billion reported in September 2021.
Direct and operating expenses amounted to $101.89 billion relative to $89.50 billion booked in 2021, indicating a 14% growth compared to twelve months earlier. Net impairment losses on financial assets totalled $213.14 million (2021: $392.40 million). Whereas direct and operating expenses for the third quarter amounted to $33.23 billion, up from $30.25 billion for the same quarter of 2021.
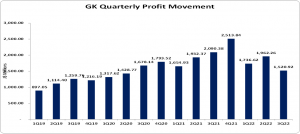
As such, gross profit for the nine months amounted to $5.33 billion relative to $5.88 billion booked for the similar period of 2021, a 9% decrease. Gross profit for the third quarter decreased by 24% to $1.52 billion compared to $2.01 billion reported for the third quarter of 2021.
Other Income during the nine-month period, fell 13% to total $2.36 billion (2021: $2.71 billion).
Interest income from non-financial services declined 2% to total $423.93 million compared to $433.58 million reported in the prior year’s corresponding period. Interest expenses from non-financial services amounted to $919.27 million versus $858.26 million a year earlier, a 7% increase.
Share of results of associated companies rose by 46% amounting to $539.24 million, versus $368.29 million reported for September 2021.
Pre-tax profits decreased 9% to $7.74 billion, compared to pre-tax profit of $8.54 billion documented for the nine-month ended September 2021. Additionally, GK incurred taxation expenses amounting to $2.09 billion compared to $2.31 billion in September 2021.
Consequently, net profit declined 9% to $5.65 billion from $6.23 billion booked for the corresponding period of 2021. Net profit for the third quarter fell 26% to $1.66 billion (2021: $2.26 billion).
Net profit attributable to shareholders amounted to $5.22 billion compared to $5.68 billion in the previous year’s corresponding period, showing an 8% decrease. Net profit attributable to shareholders for the third quarter amounted to $1.52 billion, down from the $2.09 billion booked for the same quarter of 2021.
Total comprehensive income closed the nine months at $3.27 billion (2021: $7.08 billion). Total comprehensive income for the quarter amounted to $601.25 million (2021: $2.18 billion).
Earnings per share for the third quarter amounted to $1.53 (2021: $2.10), while for the nine months GK booked an EPS of $5.25 (2021: $5.71). GK’s trailing EPS amounted to $8.05. The number of shares used in our calculations is 995,128,505 units. GK’s stock price close the trading period on November 10, 2022 at $85.85 with a corresponding P/E of 10.66 times.
Balance Sheet Highlights:
As at September 30, 2022, the Group’s assets totalled $200.75 billion, 6% or $10.65 billion more than the $190.10 billion a year ago. The improvement resulted in part from a growth in ‘Inventories and ‘Cash and Deposits’ which closed at $20.08 billion (2021: $15.22 billion) and $34.10 billion (2021: $27.13 billion), respectively.
Shareholders’ equity amounted to $69.13 billion which compares to equity of $65.07 billion as at September 30, 2021. As a result, book value per share amounted to $69.46 (2021: $65.39)
Disclaimer:
Analyst Certification -The views expressed in this research report accurately reflect the personal views of Mayberry Investments Limited Research Department about those issuer (s) or securities as at the date of this report. Each research analyst (s) also certify that no part of their compensation was, is, or will be, directly or indirectly, related to the specific recommendation(s) or view (s) expressed by that research analyst in this research report.
Company Disclosure -The information contained herein has been obtained from sources believed to be reliable, however its accuracy and completeness cannot be guaranteed. You are hereby notified that any disclosure, copying, distribution or taking any action in reliance on the contents of this information is strictly prohibited and may be unlawful. Mayberry may effect transactions or have positions in securities mentioned herein. In addition, employees of Mayberry may have positions and effect transactions in the securities mentioned herein.


