
July 20, 2018
At the end of the first quarter of 2018, the government debt to GDP ratio in the euro area rose to 86.8% compared to the end of the fourth quarter of 2017 (86.7%). In the EU28, the debt to GDP ratio dropped from 81.6% to 81.5%. Compared to the first quarter of 2017, the ratio decreased in both the euro area (89.2% to 86.8%) and the EU28 (83.6% to 81.5%).
At the close of the first quarter of 2018, euro area debt securities accounted for 80.8% of government debt, and EU28 debt securities accounted for 81.7% of government debt. Loans were responsible for 16.2% and 14.2%, whereas currency and deposits represented 3.0% of the euro area and 4.1% of the EU28 government debt. The share of intergovernmental lending (IGL) in GDP at the end of the first quarter of 2018 was 2.1% in the euro area and 1.5% in the European Union.
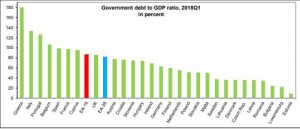
Government debt per Member State at end of first quarter 2018
The highest ratios of government debt to GDP at the end of the first quarter of 2018 were recorded in Greece (180.4%), Italy (133.4%), and Portugal (126.4%). The lowest ratios were recorded in Estonia (8.7%), Luxembourg (22.2%), and Bulgaria (24.1%).
Changes in government debt to GDP ratio (2018 Q1 to 2017 Q4)
During the fourth quarter of 2017, twelve Member States registered an increase in their debt to GDP ratio. In first quarter of 2018, sixteen Member States registered a decrease in their ratio. The highest increases in the ratio were recorded in Belgium (+2.9 pp), Greece (+1.8 pp), Italy (+1.6 pp), Slovenia (+1.4 pp). The largest decreases were recorded in Latvia (-4.4 pp), Lithuania (-3.5 pp), Cyprus (-2.8 pp), and Sweden (-2.6 pp).
Changes in government debt to GDP ratio (2018 Q1 to 2017 Q1)
When comparing both of the first quarters of 2017 and 2018, only Greece (+2.7 pp) registered an increase in its debt to GDP ratio, along with twenty seven Member States decreasing. The largest decreases were recorded in Cyprus (-11.3 pp), Ireland (-6.5 pp), Croatia (-6.4 pp), Malta (-6.2 pp), and Slovenia (-5.3 pp).
Company Disclosure -The information contained herein has been obtained from sources believed to be reliable, however its accuracy and completeness cannot be guaranteed. You are hereby notified that any disclosure, copying, distribution or taking any action in reliance on the contents of this information is strictly prohibited and may be unlawful. Mayberry may effect transactions or have positions in securities mentioned herein. In addition, employees of Mayberry may have positions and effect transactions in the securities mentioned herein.


