
March 18, 2018
Revenue dipped by 1% amounting to $674.74 million, down from $680.34 million reported a year ago. The Company had an 5% decrease in Cost of Sales to $366.10 million and consequently, Gross Profit increased by 4% or $296.71 million year-to-date to $308.65 million. For the quarter, Gross Profit increased by 4% to $164.69 million.
The Company had Other Losses totaling $5.35 million relative to the loss of $93,163 for the same period the prior financial year. Finance income declined 61% from $971,471 to $383,545. Once considered, Profit before Expenses increased by 2% to $303.69 million.
Administrative Expenses has decreased by 5% to $126.30 million (2017: $133.24 million) while Selling, Distribution & Promotion Expenses increased by 41% to $103.30 million (2017: $73.46 million). As a result, Total Expenses increased by 11% or $22.90 million to $229.60 million. For the quarter, Total Expenses increased by 5% to $118.34 million.
The increased expenses resulted in Profit from Operations declining by 18% from $90.88 million for the period under review to $74.09 million year-to-date. Finance Costs increase by 16% to $2.71 million and once considered, Profit before Taxation has declined by 19% or $17.17 million to $71.38 million.
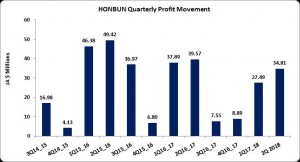
Taxation has decreased by $2.10 million or 19% to $8.98 million. Once considered, Net Profit after Taxation amounted to $62.39 million, a 19% decline relative to the $77.46 million reported in the similar period for the prior financial year. For the quarter, Net Profit after Taxation has declined by 12% to $34.8 million.
Consequently, earnings per share (EPS) amounted to $0.13 (2017: $0.16) year to date, while EPS for the quarter closed at $0.07. The twelve months trailing EPS amounted to $0.167. The number of shares used in this calculation was 471,266,950 shares. As at May 17, 2018, the stock was trading at $4.70.
Balance Sheet at a Glance:
Total Assets increased by $51.14 million or 7% to close at $762.95 million as at March 31, 2018 (2017: $711.81 million). The increase in total assets was largely due to a 24.49% increase in Property Plant and Equipment that closed the period at $437.35 million.
Shareholder’s equity totaled $599.04 million compared to the $539.31 million quoted as at March 31, 2017. This resulted in a book value of $1.27 relative to $1.14 the prior year.
Disclaimer:
Analyst Certification -The views expressed in this research report accurately reflect the personal views of Mayberry Investments Limited Research Department about those issuer (s) or securities as at the date of this report. Each research analyst (s) also certify that no part of their compensation was, is, or will be, directly or indirectly, related to the specific recommendation (s) or view (s) expressed by that research analyst in this research report.
Company Disclosure -The information contained herein has been obtained from sources believed to be reliable, however its accuracy and completeness cannot be guaranteed. You are hereby notified that any disclosure, copying, distribution or taking any action in reliance on the contents of this information is strictly prohibited and may be unlawful. Mayberry may effect transactions or have positions in securities mentioned herein. In addition, employees of Mayberry may have positions and effect transactions in the securities mentioned herein.


