Honey Bun (1982) Limited (HONBUN)
For the Nine Months Ended June 30, 2017:
Revenue grew by 7% amounting to $969.42 million, up from $903.45 million reported a year ago. The Company had a 13% increase in Cost of Sales to $550.16 million and consequently, Gross Profit increased by 1% or $3.08 million year-to-date to $419.26 million. For the quarter, Revenue declined by 2% for the quarter to total $289.08 million relative to the $296.19 reported the prior quarter.
The Company had Other gains totaling $283,563 relative to Gains of $5.88 million in 2016. Finance Income totalled $1.11 million a 47% increase to $757,993 reported in 2016.
Administrative Expenses has increased by 14% to $199.97 million (2015/16: $175.69 million) while Selling, Distribution & Promotion Expenses increased by 15% to $120.04 million (2015/16: $104.029 million). As a result, Total Expenses increased by 14% or $40.29 million to $320.01 million. For the quarter, Total Expenses increased by 20% to $113.30 million. According to the company “The main areas of increase came from significant increases in the cost of sanitation, electricity and water. For the period the company also invested heavily in building human capacity by way of contracts for consultation on key strategic areas of the business. We expect that this will have significant long term value”.
The increased expenses resulted in Profit from Operations declining by 30% from $143.10 million in 2016 to $100.65 million year-to-date. Finance Costs declined by 15% to $3.90 million and once considered, Profit before Taxation has declined by 30% or $41.78 million to $96.75 million for the period in review.
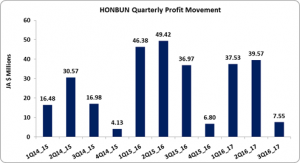
Taxation has increased significantly by $6.32 million or 110% to $12.10 million. Once considered, Net Profit after Taxation amounted to $84.66 million, a 36% decline relative to the $132.76 million reported in the similar period the prior financial year. For the quarter, Net Profit after Taxation has declined by 80% to $7.55 million compared to $36.97 million in 2016.
Consequently, earnings per share (EPS) amounted to $0.18 (2015/16: $0.28) year to date, while the twelve months trailing EPS is $0.19. The number of shares used in this calculation was 471,266,950 shares.
Balance Sheet at a Glance:
Total Assets increased by $138.73 million or 24% to close at $709.14 million as at June 30, 2017 (2015/16: $570.40 million). The increase in total assets was largely due to a 34% increase in receivables that closed the period at $96.30 million. Cash & Cash Equivalents also increase significantly by 48% from $73.09 million to $108.11 million.
Shareholder’s equity totaled $537.08 million compared to the $491 million quoted as at June 30, 2016. This resulted in a book value of $1.14 relative to $1.04 the prior year.