
May 19, 2022
ISP Finance Services Limited’s (ISP) Interest Income on loans amounted to $104.44 million compared to $90.10 million in Q1 of 2021, an increase of 16% year over year. ‘Interest Income Receivables’ amounted to $105,668 (2021: nil), after summing the two line items, Gross Interest Income for the quarter closed at $104.55 million (2021: $90.10 million).
The total value of loans issued by ISP Finance Services Ltd as at March 31, 2022 was $811.65 million (2021: $853.87 million). However, after deducting provisions for credit losses, ‘Loans net of provision for credit losses’ grew by 1% to $679.48 million from $675.94 million in Q1 of 2021.
Interest expense fell marginally to $7.12 million relative to $7.76 million in 2021 representing an 8% decline year over year. Because of the dip in interest expense, Net Interest Income rose by 18% to $97.43 million (2021: $82.34 million). Commission expense on loans in Q1 2022 amounted to $3.70 million (2021: $1.38 million).
Gross Profit for the quarter grew by 16% to $93.73 (2021: $80.96 million)
Operating Expenses also grew in Q1, up 23% from $68.13 million in 2021 to $83.50 million at the end of Q1 2022, with the growth largely due to a 70% increase in the company’s allowance for credit loss. The expenses for the quarter are broken down as follows:
-
- Staff Costs – $29.73 million (2021: $27.72 million)
-
- Allowance for Credit Losses – $24.00 million (2021: $14.10 million)
-
- Depreciation – $1.94 million (2021: $1.92 million)
-
- Other Operating Expenses – $27.83 million (2021: $24.39 million)
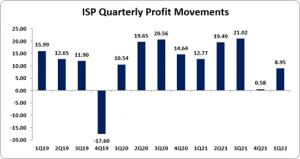
Given the disproportionately larger growth in expenses to revenue, ISP’s Profit before Taxes shrunk by 20% to $10.23 million (2021: $12.77 million). After paying $1.28 million in taxes (2021: nil), Net Profit for the quarter ended March 31, 2022, amounted to $8.95 million relative to the $12.77 million reported in 2021, a 30% decrease.
Despite the marginal dip, Cash generated from Operating Activities grew to $36.28 million (2021: $5.30 million). At the end of Q1 2021, ISP used $3.6 million more than they received which resulted in a reduction to their cash balances at the time to $28.74 million. Since ISP didn’t take on any new debt in this quarter, (though they spent $1.19 million acquiring PPE) their Cash Balance at the end of the reporting period increased by $35.08 million to $54.65 million.
Given their current earnings, ISP has an EPS of $0.085 (2021: EPS $0.122). On a 12-month trailing basis, ISP’s earnings per share is $0.48 (2021: $0.64). The number of shares used in our calculations is 105,000,000 units. Notably, ISP closed the trading period on May 18, 2022 at a price of $29.50 with a corresponding P/E of 61.89 times.
Balance Sheet Highlights:
At end of their first quarter ended March 31, 2022, ISP reported Total Assets of $773.81 million, a marginal 0.16% decrease relative to the $775.09 million reported a year prior. The slight decrease was attributable to a $26.52 million reduction in ‘Other Receivables’ to $16.98 million (2021: $43.50 million) moderated by a $25.91 million increase in ‘Cash & Cash Equivalent’ to $54.65 million (2021: $28.74 million).
Shareholders’ Equity as at March 31, 2022 was $472.09 million, 12% higher than $421.50 million reported at the end of Q1 2021. This results in a book value per share of $4.50 compared to $4.01 in Q1, 2021. A noteworthy fact, ISP’s book value per share at the end of Q1 of 2016 was $1.81. Total Equity on the balance sheet of ISP in Q1 of 2016 was $189.98 million and the company also had an Accumulated Deficit of $15.02 million. At the end of Q1 2022, ISP Finance Services Ltd had an Accumulated Surplus of $265.13 million (2021: $214.55 million). This represents an 148% growth in the equity of the company since 2016.
Disclaimer:
Analyst Certification -The views expressed in this research report accurately reflect the personal views of Mayberry Investments Limited Research Department about those issuer (s) or securities as at the date of this report. Each research analyst (s) also certify that no part of their compensation was, is, or will be, directly or indirectly, related to the specific recommendation (s) or view (s) expressed by that research analyst in this research report.
Company Disclosure -The information contained herein has been obtained from sources believed to be reliable, however its accuracy and completeness cannot be guaranteed. You are hereby notified that any disclosure, copying, distribution or taking any action in reliance on the contents of this information is strictly prohibited and may be unlawful. Mayberry may effect transactions or have positions in securities mentioned herein. In addition, employees of Mayberry may have positions and effect transactions in the securities mentioned herein.


