
Jamaica Broilers Group (JBG)
For the six months ended October 31, 2017:-
- Revenues totaled $23.02 billion, a 13% increase on the $20.43 billion reported in 2016. Revenue for the second quarter amounted to $11.53 billion compared to $10.41 billion booked for the corresponding quarter of 2016. Total revenue was broken down as follows;
-
- The Jamaica Operations contributed $16.04 billion, an 8% increase compared to $14.85 billion for the same period of 2016. JBG noted, “Jamaica Operations reported a segment result of $1.1 billion, which was $283.0 million or 21% below last year’s normalized segment result of $1.3 billion. This decrease was mainly attributed to higher distribution costs as a result of a rebalancing of the inventory in the poultry segment, as well as some third-party storage issues that took place in the first quarter.”
-
- US Operations recorded an increase of 23% to total $5.95 billion relative to $4.85 billion last year. According to the company, “Our US Operations continued to grow steadily and reported a segment result of $613.0 million, which was a 20% increase over the prior year’s result of $559.0 million. Our presence in this market remains robust with a broad and diverse customer base.”
-
- Other Caribbean Operations contributed $1.03 billion, an increase of 42% when compared to $725.14 million. Management highlighted, “In the other Caribbean Operations segment, Haiti Broilers SA continues to benefit from the increased production and sale of table eggs which increased to 31% of the market, compared to 19% of the market at the end of the second quarter last year. The segment result amounted to $265.0 million, which was 53% above the previous year’s normalised segment results of $172.0 million
- Cost of Sales grew by 14% to $17.39 billion from $15.22 billion in 2016. Gross profit for the first six months reflected an increase of 8% to close at $5.63 billion versus $5.20 billion booked for the corresponding period in 2016.
- Other income rose 95% from $72.33 million for the first six month of 2016 to $140.81 million in 2017. Distribution costs rose 31% to close at $859.05 million relative to $654.39 million recorded for the prior year’s comparable period, while administration and other expenses grew by 7% to $3.72 billion (2016: $3.47 billion). According to the company, “distribution and administrative cost of the Group, reflected an increase of 11% over the previous year due primarily to inflation and increased development costs associated with the improvement of the Group’s information systems and IT security. These expenses include one-off cost elements which are not expected to recur. Additionally, finance income decreased by $253.0 million or 95% from the prior year due to foreign exchange losses when compared to foreign exchange gains in the prior year.”
- Operating profit improved by 4%, totalling $1.20 billion relative to $1.15 billion last year.
- JBG reported finance income of $13.84 million (2016: $266.47 million) a decrease of 95%, while finance costs increased marginally to $310.53 million relative to $309.77 million in 2016.
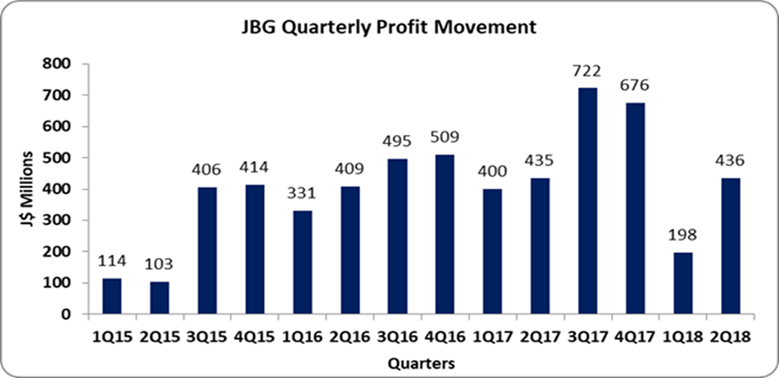
- Profit before taxation decreased for the period amounting to $898.70 million (2016: $1.11 billion). Tax charges for the period totalled $240.26 million (2016: $269.27 million). As such, net profit amounted to $658.44 million (2016: $841.17 million). Net profit for the quarter amounted to $445.86 million relative to $439.11 million booked last year
- Net profit attributable to shareholders amounted to $633.47 million relative to $834.59 million booking for the comparable period in 2016. Net profit attributable to shareholders for the quarter totalled $435.78 million versus $434.57 million booked for the second quarter of 2016.
- Total comprehensive income for the first six months amounted to $649.72 million relative to a $27.24 million. Notably, JBG reported exchange differences on translating discontinued operations of $956.12 million for the first six months of 2016.
- Consequently, earnings per share totaled $0.53 relative to $0.70 booked for the first six months of 2017. EPS for the second quarter amounted to $0.36 versus $0.36
- The trailing twelve months EPS amounted to $1.69. The total shares used in our calculation amounted to 1,199,276,400 units.
Balance sheet at a glance:-
- Total assets amounted to $27.92 billion as at October 31, 2017 relative to $25.19 billion a year prior. The increase in total assets was due mainly an increase in ‘Biological Assets’ and ‘Property, Plant & Equipment’ which rose 22% and 10% respectively. ‘Biological Assets’ and ‘Property, Plant & Equipment’ as at October 31, 2017 amounted to $4.57 billion (2016: $3.75 billion) and $7.82 billion (2016: $7.12 billion) respectively.
- Shareholders equity amounted to $14.86 billion (2016: $1297 billion) with a book value per share of $12.39 (2016: $10.82).
Disclaimer:
Analyst Certification -The views expressed in this research report accurately reflect the personal views of Mayberry Investments Limited Research Department about those issuer (s) or securities as at the date of this report. Each research analyst (s) also certify that no part of their compensation was, is, or will be, directly or indirectly, related to the specific recommendation (s) or view (s) expressed by that research analyst in this research report.
Company Disclosure -The information contained herein has been obtained from sources believed to be reliable, however its accuracy and completeness cannot be guaranteed. You are hereby notified that any disclosure, copying, distribution or taking any action in reliance on the contents of this information is strictly prohibited and may be unlawful. Mayberry may effect transactions or have positions in securities mentioned herein. In addition, employees of Mayberry may have positions and effect transactions in the securities mentioned herein.

