
March 11, 2022
For the nine months ended January 31 ,2022, Jamaica Broilers Group (JBG) reported total revenues of $55.13 billion, a 33% increase on the $41.32 billion reported in 2021. Revenue for the third quarter closed at $19.31 billion (2021: $14.77 billion). Total revenue for the nine months is broken down as follows. Of total revenues:
- The Jamaica Operations contributed $32.25 billion (2021: $25.04 billion).
- US Operations recorded revenue of $21.78 billion (2021: $14.53 billion), this increase according to management “was primarily driven by (1) the increased production and sales in The Best Dressed Chicken line of products and (2) the Operation’s participation in the employee benefit programme which was offered to alleviate the impact of COVID-19, amounting to $584 million which is reported as other income, during the quarter.”
- Haiti Operating increased year over year to $1.11 billion (2021: 1.75 billion).
Cost of Sales grew by 40% to $43.31 billion from $31.03 billion in 2021. As such, gross profit for the nine months reflected an increase of 15% to close at $11.83 billion versus $10.29 billion booked for the corresponding period in 2021. Gross profit for the quarter amounted to $4.48 billion relative to $3.84 billion for the corresponding quarter in 2021.
Other income rose 107% from $453.48 million in 2021 to $937.02 million in 2022. Distribution costs increased by 10% to close at $1.87 billion relative to $1.70 billion recorded for the prior year’s comparable period, while administration and other expenses rose by 23% to $7.45 billion (2021: $6.07 billion).
Operating profit for the period increased by 16%, totaling $3.44 billion relative to $2.97 billion for the nine months ended January 2021. Operating profit for the third quarter improved 37% to $1.74 billion (2021: $1.27 billion).
JBG reported $12.67 million for finance income for the period (2021: nil).
Profit before taxation for the period rose to $2.59 billion (2021: $2.46 billion). Profit before tax for the quarter closed at $1.47 billion in contrast to $940.36 million reported twelve months prior. Tax charges for the nine months totalled $547.43 million (2021: $598.05 million).
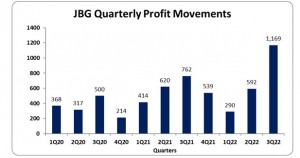
As such, net profit amounted to $2.04 billion, a 9% increase compared to the $1.86 billion booked for the same period in 2021. Net profit for the quarter amounted to $1.17 billion versus $757.70 million in 2021.JBG noted, “Our US Operations was the major driver in this performance with a 111% increase in segment profit versus the prior year, following our expansion into producing and supplying The Best Dressed Chicken in the US market.”
Net profit attributable to shareholders amounted to $2.05 billion relative to $1.80 billion booked for the comparable period in 2021. Net profit attributable to shareholders for the third quarter closed at $1.17 billion (2021: $761.96 million).
Total comprehensive income for the period amounted to $2.08 billion relative to $2.51 billion recorded in 2021. For the quarter, total comprehensive income closed at $1.34 billion (2021: $772.48 million).
Consequently, earnings per share totalled $0.97 relative to $0.64 booked for the third quarter of 2021, while for the nine months ended January 2022, the EPS amounted to $1.71 (2021: $1.50). The trailing earnings per share amounted to $2.16. The total shares used in our calculation amounted to 1,199,276,400 units. Notably, JBG closed the trading period on March 11, 2022 at a price of $28.95 with a corresponding P/E ratio of 13.64 times.
Balance sheet at a glance:-
Total assets amounted to $55.46 billion as at January 31, 2022 relative to $47.08 billion a year prior. The increase in total assets was due mainly an increase in ‘Biological Assets’ and ‘Inventories’ which rose 32% and 18% respectively. ‘Biological Assets’ and ‘Inventories’ as at January 31 2022 amounted to $12.75 billion (2021: $9.68 billion) and $13.56 billion (2021: $11.53 billion) respectively.
Shareholders equity as at January 31, 2022 amounted to $20.82 billion (2021: $18.10 billion), with a book value per share of $17.23 (2021: $14.91).
Disclaimer:
Analyst Certification -The views expressed in this research report accurately reflect the personal views of Mayberry Investments Limited Research Department about those issuer (s) or securities as at the date of this report. Each research analyst (s) also certify that no part of their compensation was, is, or will be, directly or indirectly, related to the specific recommendation(s) or view (s) expressed by that research analyst in this research report.
Company Disclosure -The information contained herein has been obtained from sources believed to be reliable, however its accuracy and completeness cannot be guaranteed. You are hereby notified that any disclosure, copying, distribution or taking any action in reliance on the contents of this information is strictly prohibited and may be unlawful. Mayberry may effect transactions or have positions in securities mentioned herein. In addition, employees of Mayberry may have positions and effect transactions in the securities mentioned herein.


