
August 15, 2024
Jamaica Producers Limited (JP)
Unaudited financials for the six months ended June 30, 2024:
Jamaica Producers Limited (JP), for the six months ended June 30, 2024, reported a 99% decrease in Turnover totaling $52.30 million compared to $7.09 billion in the corresponding period last year. Turnover for the second quarter had a 12% decrease to close at $24.97 million compared to $28.41 million for the comparable quarter of 2023. This results from the company normalizing its operations after the successful amalgamation of the group’s operating business with the Pan Jamaica Group Limited (“PJG”). This amalgamation became effective on April 1, 2023. It involved the transfer of JPG’s operating businesses to PJG in exchange for JPG receiving a 34.5% interest in PJG, making JPG its single largest shareholder. JPG is now an associated company of JPG. JPG’s associated company interest in PJG is JPG’s single largest asset.
Under the new operating structure, strategic decisions were made that significantly impacted the financials. There wasn’t any cost of sales accounted for last year over similar periods; it was $5.06 billion, representing a decrease of 100% year over year. Consequently, gross profit decreased by 97% to $52.30 million compared to $2.03 billion for the six months ended June 30, 2023. The company booked gross profit of $24.97 million for the second quarter versus $28.41 million reported for the similar quarter of 2023.
Operating profit saw a significant 104% decrease from $860.19 million in 2023 to an operating loss of $34.25 million in the period under review. As a result, the share of profit/(loss) in the associated company and joint venture company for the six months ended June 30, 2024, amounted to $628.71 million, a 1% increase relative to $620.71 million reported in 2023.
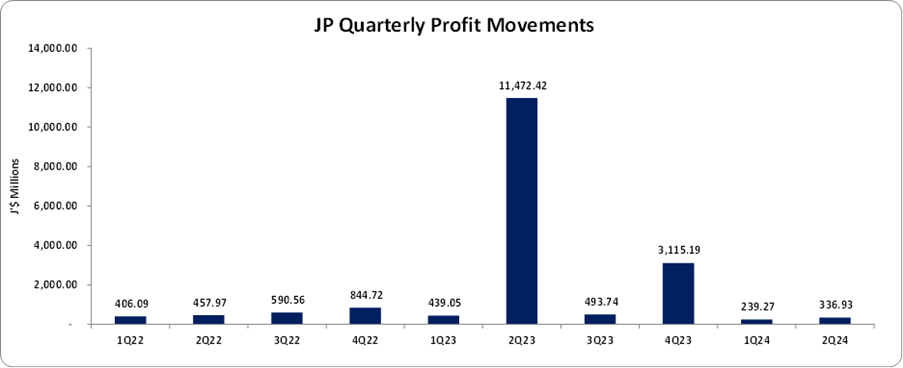
Profit before finance cost and taxation for the six months ended June 30, 2024, amounted to $594.46 million, a 95% decrease relative to $12.57 billion reported in 2023. Profit before finance cost and taxation for the second quarter amounted to $345.54 million (2023: $11.48 billion). Finance Cost-Interest totaled $12.84 million, an 81% decrease from last year’s corresponding period. (2023: $66.82 million).
Profit Before Income Tax for the six months ended June 30, 2024, amounted to $581.62 million, a 95% decrease relative to $12.50 billion reported in 2023. Profit Before Income Tax for the second quarter amounted to $338.44 million (2023: $11.47 billion).
Income Tax Expenses for the six months ended June 30, 2024, increased 97% to $5.41 million (2023: $190.11 million). Net Profit for the six months amounted to $576.21 million, a 95% decrease from the $12.31 billion reported in 2023. For the second quarter, Net Profit was $336.94 million (2023: $11.47 billion).
Consequently, Earnings Per Share for the six months amounted to $0.51 (2023: EPS: $10.61), while Earnings Per Share for the quarter totaled $0.30 (2023: EPS: $10.22). The twelve-month trailing EPS was $3.73, and the number of shares used in these calculations was 1,122,144,036. These figures reflect the company’s long-term perspective and its commitment to delivering value to its shareholders.
Notably, JP’s stock closed the trading period on August 14, 2024, at $23.81, with a corresponding P/E ratio of 6.38x.
Balance Sheet Highlights
The company’s assets totaled $37.18 billion (2023: $31.85 billion). The increase in the company’s total asset base is attributed to 13% YoY increase in “Interest in associated companies and joint venture” ending the quarter at $34.17 billion (2023: $30.14 billion), an astronomical rise in “Investment Property” ending the quarter at $1.72 billion (2023: nil), and a 12% YoY increase in “Cash and cash equivalents” ending the quarter $23.16 million (2023: $20.68 million).
Shareholder’s equity was $36.75 billion (2023: $31.39 billion), representing a book value per share of $32.75 (2023: $27.97). The increase in total shareholder’s equity holders equity is driven by a 17% YoY increase in the company’s “Reserves” account, ending the quarter at $36.64 billion (2023: $31.28 billion)
Disclaimer:
Analyst Certification -The views expressed in this research report accurately reflect the personal views of Mayberry Investments Limited Research Department about those issuer (s) or securities as at the date of this report. Each research analyst (s) also certify that no part of their compensation was, is, or will be, directly or indirectly, related to the specific recommendation(s) or view (s) expressed by that research analyst in this research report.
Company Disclosure -The information contained herein has been obtained from sources believed to be reliable, however its accuracy and completeness cannot be guaranteed. You are hereby notified that any disclosure, copying, distribution or taking any action in reliance on the contents of this information is strictly prohibited and may be unlawful. Mayberry may effect transactions or have positions in securities mentioned herein. In addition, employees of Mayberry may have positions and effect transactions in the securities mentioned herein.

