
For the first half of the 2017 financial year, the company recorded a total revenue of $103.72 million (2016: $90.69 million), representing a 14% increase in revenue. While for the second quarter revenues increased 18% to total $54.32 million.
Cost of sales increased by 16% to $32.81 million compared to the $28.35 million reported in 2016; as a result, Gross profit was up 14% to total $70.91 million relative to $62.33 million in 2016. While gross profit for the quarter grew 14% to total $37.04 million compared to $32.41 million in 2016.
Other operating income grew by 537% to $5.86 million relative to $919,000. In addition, Administrative and Other Expenses increased by 16% from $53.27 million in the first half of 2016 to $61.86 million for the same period of 2017.
Consequently, profit from operation amounted to $14.91 million in contrast to the $9.98 million for the same period last year, this represents a 49% increase.
The company recorded finance income of Nil relative to $155.54 million last year. Finance and depreciation costs declined to $7.8 million when compared to $11.01 million for the same period of 2016.
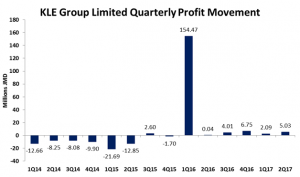
This further resulted in a net profit for the period of $7.12 million compared to net profit of $154.15 million for the comparable period in 2016.
Earnings per share amounted to $0.07 for the nine months, (2016: earnings per share $1.54) while EPS for the quarter totaled $0.050 this compares to EPS of $0.0004 in 2016. The twelve-month trailing earnings per share (EPS) amounted to $0.18. The number of shares used in our calculations is 100,000,000.
Balance Sheet Highlights:
The company, as at June 30, 2017, recorded total assets of $223.98 million, a decline of 0.19% when compared to $224.39 million in 2016.
Total Stockholders’ Equity as at June 30, 2017 was $141.90 million, up from $127.27 million last year. This resulted in a book value of $1.42.
Disclaimer:
Analyst Certification -The views expressed in this research report accurately reflect the personal views of Mayberry Investments Limited Research Department about those issuer (s) or securities as at the date of this report. Each research analyst (s) also certify that no part of their compensation was, is, or will be, directly or indirectly, related to the specific recommendation (s) or view (s) expressed by that research analyst in this research report.
Company Disclosure -The information contained herein has been obtained from sources believed to be reliable, however its accuracy and completeness cannot be guaranteed. You are hereby notified that any disclosure, copying, distribution or taking any action in reliance on the contents of this information is strictly prohibited and may be unlawful. Mayberry may effect transactions or have positions in securities mentioned herein. In addition, employees of Mayberry may have positions and effect transactions in the securities mentioned herein.


