
Date: November 07, 2018
Lasco Distributors Limited (LASD), for the six months ended September 30, 2018, posted 5% growth revenues to $8.78 billion, up from $8.35 billion in the corresponding period in 2017. For the quarter, revenues increased by 7% closing at $4.50 billion (2017: $4.22 billion).
Cost of sales amounted to $7.01 billion, up 4% on the $6.71 billion reported in the prior comparable period. Within the second quarter, cost of sales went up by 6% to $3.60 billion versus $3.40 billion in the previous quarter in 2017.
Consequently, gross profit recorded an increase of 8% year over year, closing at $1.78 billion compared to the $1.64 billion generated for same period in the prior year. However, gross profit for the quarter climbed by 10% totalling $904.25 million (2017: $822.04 million).
Other operating income jumped grossly by 431% to end the six months period at $103.92 million relative to 19.57 million in the corresponding period last year. For the quarter, other operating income also increased significantly by 5261% to $61.23 million (2017: $1.14 million).
Operating Expenses of $1.38 billion was booked for the six months, a growth of 13% on $1.21 billion recorded for the comparable period of 2017. Operating Expenses went up by 21% for the second quarter amounting to $716.73 million (2017: $591.06 million). LASD highlighted that, “During the period, the company increased its investment in marketing to support the introduction of its new carbonate drinks LYRIX, energy drink KONKA as well as its 50% less sugar LASCO Food drink which were recently launched.”
Operating profit improved by 12% to close at $502.49 million for the period under review. For the quarter, there was a 7% growth posted closing at $248.75 million relative to $232.13 million in the prior comparable quarter in 2017.
Finance Cost increased by 32%, totalling $323,000 for the period compared to $245,000 in the year prior.
Pre-tax Profits amounted to $502.17 million, an increase of 12% from the $448.96 million in the previous year. Pre-tax profits saw a 7% increase in the second quarter closing at $248.60 million (2017: $232.02 million).
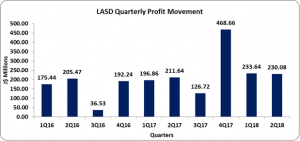
Net Profit for the period closed at $463.72 million (2017: $408.50 million), a 14% climb year over year. As for the second quarter, Net Profit increased by 9% to $230.08 million (2017: $211.64 million).
Earnings Per Share for the six months ended September 2018 totalled $0.13 versus $0.12 for the corresponding period in 2017. For the quarter, Earnings Per Share amounted to $0.07 (2017: $0.06). The trailing twelve months EPS is $0.30. The total amount of shares outstanding used for this calculation was 3,497,615,571 units. Notably, LASD’s closed the trading period on November 06, 2018, at $3.99.
Balance sheet at a glance:
As at September 30,2018, ‘Total Assets’ amounted to $8.87 billion, 13% more than last year’s $7.82 billion. ‘Total Non-Current Assets’ totalled $1.74 billion (2017: $1.56 billion), an 11% increase over the corresponding period last year. The Company mentioned that, “this increase resulted from investment in equipment and warehouse infrastructure.” Notably, ‘Property, Plant and Equipment’ closed at $1.62 billion, rising by 13% over the previous year. ‘Cash and Cash Equivalents’ and ‘Inventories’ also contributed to this increase in assets with a 74% and 16% growth to close at $1.49 billion (2017: $859.89 million) and $2.56 billion (2017: $2.21 billion), respectively.
Shareholders equity amounted to $5.04 billion as at September 30, 2018 (2017: $4.31 billion), reflecting an increase of 17%. This translated in book value per share of $1.44 (2017: $1.23).
Disclaimer: Analyst Certification -The views expressed in this research report accurately reflect the personal views of Mayberry Investments Limited Research Department about those issuer (s) or securities as at the date of this report. Each research analyst (s) also certify that no part of their compensation was, is, or will be, directly or indirectly, related to the specific recommendation (s) or view (s) expressed by that research analyst in this research report.
Company Disclosure -The information contained herein has been obtained from sources believed to be reliable, however its accuracy and completeness cannot be guaranteed. You are hereby notified that any disclosure, copying, distribution or taking any action in reliance on the contents of this information is strictly prohibited and may be unlawful. Mayberry may effect transactions or have positions in securities mentioned herein. In addition, employees of Mayberry may have positions and effect transactions in the securities mentioned herein.


