
Main Event Entertainment Group Limited (MEEG) for the six months ended April 31, 2017 recorded a total of $652.15 million in revenue compared to $602.99 million booked for the comparable period in 2016. The growth according to the company, “reflects increased sales in all three segments of the of the business, with the most significant contributions from Entertainment and Promotions segment, which is up 6% or $28.764 million and the Digital Signage segment, up 32% or $13.513 million). Revenue for the quarter recorded a marginal increase from $318.71 million booked in April 2016 to $319.33 million.
Cost of sales for the period decreased 5% year over year to $347.73 million relative to $365.21 million. As such, gross profit for the six months improved by 28% to $304.43 million (2016: $237.792 million). Management noted, “the margin was positively influenced by the continuing investment in fleet and transportation solutions, general and rental equipment and human resources.”
MEEG booked other income of $437,000 for the period, compared to a loss of $273,000 documented for the prior year’s corresponding period.
Total expenses rose 34% to $222.31 million versus $165.48 million recorded in 2016. Of this, administrative and general expenses climbed 35% to $178 million (2016: $131.81 million), while depreciation expense increased 29% to $37.18 million (2016: $28.88 million). Selling and promotion expense recorded an increase of 49% to $7.13 million relative to $4.80 million. The main contributing elements to the increase were “fleet management costs, marketing expenses, staff costs and depreciation charges.” Total expenses for the quarter climbed 35% to close at $117.71 million relative to $87.20 million.
Consequently, operating profit amounted to $82.55 million (2016: $72.03 million), an increase of 15% year over year.
Finance cost inched up 1% to close at $7.69 million from $7.63 million booked last year.
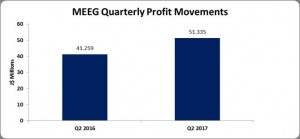
Consequently, MEEG’s net profit improved by 16% or $10.46 million to $74.86 million (2016; $64.40 million). Profit for the quarter improved 24% year over year to $51.34 million (2016; $41.26 million).
Earnings per share (EPS) for the six months totaled $0.25 (2016: $0.21), while for the quarter the EPS amounted to $0.17 (2016: $0.14). The trailing EPS amounted to $0.22. The number of shares used in the calculation was 300,005,000 units.
Balance Sheet Highlights:
As at April 31, 2017, the company’s assets totaled $768.22 million, $257.42 million more than its value a year ago of $510.80 million. This increase in total assets was largely driven by increases in ‘Property, Plant and Equipment’ which rose 38% or $118.14 million year over year to $429.79 million (2016: $311.65 million).
Equity attributable to stockholders of the company amounted to $420.11 million (2016: $250.143 million). This translated to a book value per share of $1.40 relative to $0.83 in 2016.
Disclaimer:
Analyst Certification -This research report is for information purposes only and should not be construed as a recommendation. Each research analyst (s) also certify that no part of their compensation was, is, or will be, directly or indirectly, related to the specific recommendation (s) or view (s) expressed by that research analyst in this research report.
Company Disclosure -The information contained herein has been obtained from sources believed to be reliable, however its accuracy and completeness cannot be guaranteed. You are hereby notified that any disclosure, copying, distribution or taking any action in reliance on the contents of this information is strictly prohibited and may be unlawful. Mayberry may effect transactions or have positions in securities mentioned herein. In addition, employees of Mayberry may have positions and effect transactions in the securities mentioned herein.


