
Date: October 18, 2018
Consumer Price Index -September 2018
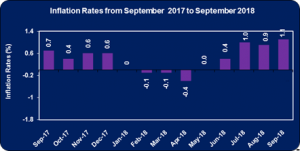
The consumer price index for the month of September 2018 increased 1.1%, following the 0.9% increase in August 2018, according to The Statistical Institute of Jamaica (STATIN). The Consumer Price Index for the month of September advanced to 255.6, relative to the 252.8 reported for August 2018. This increase was largely attributed to the movement in two divisions, ‘Food and Non-Alcoholic Beverages’ up by 0.9% and ‘Housing, Water, Electricity, Gas and Other Fuels’’ up by 4.6%. Inflation within the Greater Kingston Metropolitan Area and Other Urban Centres each registered increase in their respective index of 1.2% and 1.1% respectively, while the index for Rural Areas increased by 1.0%.
The index for the ‘Housing, Water, Electricity, Gas and Other Fuels’ division recorded a 4.6% increase in its index for September 2018, following a 0.1% upward movement for August 2018. This was a result of the groups ‘Electricity, Gas and Other Fuels’ registering an increase of 7.6%. According to STATIN, this movement was “due to higher electricity rates.” In addition, the group ‘Water Supply and Miscellaneous Services Related to the Dwelling’ increased 3.1% due to increased water and sewage rates.
The index for the ‘Food and Non-Alcoholic Beverages’ division also recorded a 0.9% increase in its index for September 2018, following a 1.6% upward movement for August 2018. This resulted from the upward movements within the ‘Food’ and ‘Non-Alcoholic Beverages’ groups by 0.9% and 0.4% respectively. Within the ‘Food’ group, the class ‘Vegetables and Starchy Foods’ increased 2.1% where the largest contributor ‘Fruits’ increased by 1.8% followed by ‘Bread and Cereals’ increasing 0.6% and ‘Meat’ and ‘Food Products’ both advancing 0.4%. Within the ‘Non-Alcoholic Beverages’ group the classes ‘Mineral Waters, Soft Drinks, Fruit and Vegetable Juices’ and ‘Coffee, Tea, and Cocoa’ recorded increases of 0.6% and 0.1% respectively.
The index for the divisions ‘Clothing and Footwear’, ‘Transport’ and ‘Miscellaneous Goods and Services’ all recorded increases of 0.3%. Within the division ‘Clothing and Footwear’, the group ‘Footwear’ moved upwards by 0.5%, while the ‘Clothing’ group advanced 0.2%. For the ‘Transport’ division, the upward movement was “mainly attributable to a rise in prices for petrol” while the increase in the division ‘Miscellaneous Goods and Services’ was due to the “increase in the cost of personal care products and services”.
The division ‘Furnishings, Household Equipment & Routine Household Maintenance’ recorded an increase of 0.2% for September 2018. This movement was primarily driven by a 0.2% climb in both the groups ‘Goods and Services for Routine Household Maintenance’ and ‘Household Appliances’ while the group ‘Household Textiles’ advanced 0.3%. The division ‘Education’ also registered an increase of 2.6%, “influenced mainly by an increase in tuition fees at the beginning of the new school year.”
The divisions ‘Communication’ and ‘Alcoholic Beverages’ each grew by 0.1% for September 2018. The former was “mainly as a result of a rate change during the month under review” while the upward movements in the ‘Alcoholic Beverages’ division was attributed to the price increases for ‘Wine’ and ‘Spirits’
Notably, the other divisions ‘Health’, ‘Recreation and Culture’ and ‘Restaurants and Accommodation Services’ had no effect on the index for September 2018.
The Inflation rate year to date is 2.8%, while the point-to-point rate (September 2017 – September 2018) and fiscal year 2018/ 2019 was 4.3% and 3.0% respectively. Individual divisions saw the following changes:
- Food and Non-Alcoholic Beverages: (0.9%)
- Alcoholic Beverages and Tobacco: (0.1%)
- Clothing and Footwear: (0.3%)
- Housing, Water, Electricity, gas and Other Fuels: (4.6%)
- Furnishing, Household Equipment and Routine Household Maintenance: (0.2%)
- Health: (0.0%)
- Transport: (0.3%)
- Communication: (0.1%)
- Recreation and Culture: (0.0%)
- Education: (2.6%)
- Restaurants and Accommodation Services: (0.0%)
- Miscellaneous Goods and services: (0.3%)
Disclaimer: Analyst Certification -The views expressed in this research report accurately reflect the personal views of Mayberry Investments Limited Research Department about those issuer (s) or securities as at the date of this report. Each research analyst (s) also certify that no part of their compensation was, is, or will be, directly or indirectly, related to the specific recommendation (s) or view (s) expressed by that research analyst in this research report.
Company Disclosure -The information contained herein has been obtained from sources believed to be reliable, however its accuracy and completeness cannot be guaranteed. You are hereby notified that any disclosure, copying, distribution or taking any action in reliance on the contents of this information is strictly prohibited and may be unlawful. Mayberry may effect transactions or have positions in securities mentioned herein. In addition, employees of Mayberry may have positions and effect transactions in the securities mentioned herein.


