Date: January 25, 2019
Net interest income for the three months ended December 31, 2018 increased by 30%, relative to 2017, to total $9.85 billion (2017: $7.55 billion). The Group stated that, “The increase was fuelled by a 22% growth in National Commercial Bank Jamaica Limited’s (NCBJ’s) loan portfolio which resulted in a 16% rise in interest income from loans for that entity.”
Net fees and commission income amounted to $4.34 billion, an increase of 20% on 2017’s $3.61 billion. NCBFG stated that, “this was stemming from the consolidation of Clarien, increased credit related and e-commerce fees.”
The Bank also reported a gain on foreign currency and investment activities of $4.17 billion, a growth of 34% relative to $3.12 billion in 2017. Management highlighted that, “this was primarily due to higher exchange income resulting from the 5% appreciation of the Jamaican currency against the US dollar.” Insurance premium income for the first quarter increased grossly by 161% to close the period at $184.16 million versus $70.66 million in the prior corresponding period. While, dividend income went up slightly by 2% to $2.14 billion (2017: $2.11 billion).
Other operating income fell by 81% to $47.82 million relative to $245.79 million in the previous comparative quarter. Total operating income for the three months period recorded a 24% growth to $20.73 billion (2017: $16.70 billion).
Total operating expenses for the three months period amounted to $15.88 billion, an increase of 21% compared to the $13.16 billion reported for the previous corresponding quarter. Management noted, “The consolidation of Clarien accounted for $1.7 billion of this increase.” Of total operating expenses:
Staff costs increased 15% to $6.78 billion relative to $5.91 billion in 2017.
Other operating expenses grew by 29% to $6.03 billion (2017: $4.66 billion).
Provision for credit losses increased 601% to $1.02 billion (2017: $145.86 million), while depreciation and amortization grew by 95% to $1.30 billion (2017: $666.01 million). The Group indicated that, “this was related to digital investments and amortization of acquired intangibles following acquisition of Clarien.” Policyholders’ and annuitants’ benefits and reserves fell by 65% to $617.33 million relative to $1.78 billion for the prior corresponding quarter. Impairment losses on securities amounted to $132.12 million relative to nil in 2017.
Consequently, operating profit increased 37% to total $4.85 billion (2017: $3.53 billion). ‘Share of profit of associates’ climbed 61% to close the period at $818.86 million compared to $509.12 million in the prior comparable quarter.
Gain on disposal of associate amounted to $3.29 billion (2017: nil). It was noted that, “The net profit includes a gain of $3.3 billion from the disposal of equity investment in JMMB Group Limited (JMMB).
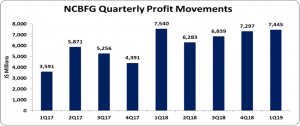
Consequently, profit before taxation increased 6% to $8.96 billion relative to $8.43 billion in 2017. After taxation of $1.56 billion (2017: $893.98 million), Net profit for the first quarter totalled $7.40 billion, a decline of 2% compared to $7.54 billion in 2017. Net profit attributable to shareholders closed at $7.45 billion relative to $7.54 billion.
Earnings per share (EPS) for the three months period totalled $3.02 relative to $3.06 booked in 2017. The trailing twelve-month EPS amounted to $11.04. The number of shares used in our calculations amounted to 2,466,762,828 units. NCBFG stock price closed the trading period at a price of $144.99 on January 24, 2019.
Balance Sheet at a glance:
Total Assets increased by 10% to $940.91 billion as at December 31, 2018 from $859.24 billion a year ago. This increase stemmed mainly from the growth in ‘Loans & Advances, Net of Provision for Credit Losses’ which moved from $322.59 billion to $373.49 billion, a 16% increase. Other notable contributors to the increase in the asset base were ‘Pledged Assets which rose from $130.97 billion as at December 31, 2017 to $179.69 billion as at December 31, 2018. ‘Cash in Hand and Balances at Central Banks’ and ‘Investment Securities as fair value through profit or loss (FVTPL)’ which closed the period at $58.54 billion (2017: $55.29 billion) and $9.40 billion (2017: $3.51 billion), respectively.
Shareholders’ Equity as at December 31, 2018 closed at $140.64 billion relative to $130.02 billion a year ago. This resulted in a book value per share of $57.01 (2017: $52.71).
Disclaimer: Analyst Certification -The views expressed in this research report accurately reflect the personal views of Mayberry Investments Limited Research Department about those issuer (s) or securities as at the date of this report. Each research analyst (s) also certify that no part of their compensation was, is, or will be, directly or indirectly, related to the specific recommendation (s) or view (s) expressed by that research analyst in this research report.
Company Disclosure -The information contained herein has been obtained from sources believed to be reliable, however its accuracy and completeness cannot be guaranteed. You are hereby notified that any disclosure, copying, distribution or taking any action in reliance on the contents of this information is strictly prohibited and may be unlawful. Mayberry may effect transactions or have positions in securities mentioned herein. In addition, employees of Mayberry may have positions and effect transactions in the securities mentioned herein.