July 25, 2019
NCB Financial Group Limited (NCBFG), for the nine months ended June 30, 2019, reported a 27% increase in net interest income relative to the corresponding period in 2018, to total $32.36 billion (2018: $25.42 billion). The movement according to management was due to, “growth in our loan portfolio, the consolidation of GHL and the inclusion of nine months of financial performance of Clarien Group Limited (Clarien) compared to six months in the prior year”. For the quarter, Net Interest Income improved 30% to close at $12.37 billion (2018: $9.51 billion). Interest income for the period rose 23% year over year to $45.68 billion compared to $37.92 billion in 2018, while interest expense amounted to $14.32 billion relative to $12.51 billion for the corresponding period in 2018.
Net Fees and Commission Income amounted to $13.38 billion, an increase of 15% on 2018’s $11.69 billion.
The bank also reported a gain on foreign currency and investment activities of $8.75 billion, a decline of 23% relative to $11.41 billion in 2018. The Company noted, “driven by a reduction in gains from the sale of debt securities. Net results from insurance activities for the period increased 218% to $7.24 billion (2018: $2.28 million). According to NCBFG, “the net result from insurance activities grew by $5.0 billion or 218% over the prior year. One of our Jamaican life insurance subsidiaries benefitted from improved spread performance and changing mortality assumptions, resulting in a significant contribution to the net profit. The consolidation of GHL’s insurance activities contributed 45% of net insurance revenues reported for the third quarter.”
Dividend income increased by 127% to a total of $790.69 million (2018: $348.04 million). Other Operating Income fell by 3% to $496.35 million (2018: $513.52 million). Consequently, total operating income increased 22% to a total of $63.02 billion (2018: $51.65 billion). Total operating income for the third quarter recorded a 28% growth to $24.55 billion (2018: $19.14 billion).
Total Operating Expenses for the period amounted to $45.93 billion, an increase of 41% compared to the $32.68 billion reported for the nine months ended June 30, 2018. Expenses for the quarter rose 64% to close at $18.09 billion compared to $11 billion in 2018. According to NCBFG, “The consolidation of GHL and an additional quarter of Clarien’s results in the current reporting period contributed to 43% of this increase. The increased expenditure resulted in a cost to income ratio of 67.1%, up from 60.6% in the prior year; however, we have implemented cost optimisation strategies to ensure efficiency initiatives underway are successfully executed.” Of these expenses:
-
- Staff costs increased 31% to $21.62 billion relative to $16.55 billion in 2018.
- Other operating expenses grew by 33% to $16.30 billion (2018: $12.30 billion).
Provision for credit losses increased 166% to $3.65 billion (2018: $1.37 billion), while depreciation and amortization grew by 77% to $4.36 billion (2018: $2.46 billion). NCBFG attributed the movement in depreciation and amortization to, “the amortization of intangibles related to our acquisition of Clarien and GHL and infrastructure improvements carried out in the current year.”
Consequently, operating profit decreased 10% to total $17.10 billion (2018: $18.97 billion). ‘Share of profit of associates’ rose by 47% to total $2.66 billion compared to $1.81 billion in 2018. The Group also reported negative goodwill on acquisition of subsidiary in 2018 of $4.39 billion relative to nil in 2019. This was as related to “the acquisition of Clarien”. ‘Gain on remeasurement of associate investment’ for the period amounted $2.33 billion relative to nil in 2018. Management indicated, “The results include a provisional gain of $2.3 billion on the remeasurement of the associate interest in Guardian Holdings Limited (GHL). The relevant accounting standard requires that the previous non-controlling interest be remeasured at the acquisition date fair value and any resulting gain or loss be recognised in the income statement.”
Gain on disposal of associate closed the period at $3.29 billion versus nil in 2018. According to management, “The Group disposed of 326,277,325 shares in JMMB Group Limited on December 27, 2018 at a price of $28.25 per share, resulting in the recording of a gain on disposal of $3.3 billion in the current period. JMMB Group Limited is therefore no longer an associate company of the Group.”
Consequently, profit before taxation increased 1% to $25.37 billion relative to $25.17 billion in 2018.
After accounting for taxation of $4.07 billion (2018: $4.22 billion), net profit for the nine months totalled $21.31 billion, an increase of 2% compared to $20.95 billion for the corresponding period of 2018. Without the goodwill, net profit would have increased by approximately 29%.
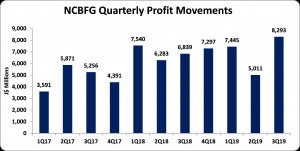
Net profit attributable to shareholders closed at $20.75 billion for the nine months relative to $20.66 billion in 2018. Net profit attributable to shareholders for the quarter amounted to $8.29 billion (2018: $6.84 billion).
Earnings per share (EPS) for the nine months ended June 30, 2019 totalled $8.41 relative to $8.38 booked for the comparable period of 2018. The EPS for the third quarter amounted to $3.36 (2018: $2.77). The trailing twelve month EPS amounted to $11.37. The number of shares used in our calculations amounted to 2,466,762,828 units. NCBFG stock price closed the trading period at a price of $217.05 on July 25, 2019.
Balance Sheet at a glance:
Total Assets increased by 68% to $1.57 trillion as at June 30, 2019 from $931.19 billion a year ago. This increase stemmed mainly from the growth in ‘Investment securities at fair value through profit or loss’ from $2.90 billion to $176.82 billion. Other notable contributors to the increase in the asset base were ‘Investment securities classified as FVOCI and amortised cost’ and ‘Pledged assets’ which rose 52% and 64% respectively to $371.19 billion (2018: $244.68 billion) and $209.24 billion (2018: $127.42 billion) respectively.
Shareholder’s Equity as at June 30, 2019 stood at $137.03 billion relative to $1124.24 billion a year ago. This resulted in book value per share of $55.55 (2018: $50.36).
Disclaimer:
Analyst Certification -This research report is for information purposes only and should not be construed as a recommendation. Each research analyst (s) also certify that no part of their compensation was, is, or will be, directly or indirectly, related to the specific recommendation (s) or view (s) expressed by that research analyst in this research report.
Company Disclosure -The information contained herein has been obtained from sources believed to be reliable, however its accuracy and completeness cannot be guaranteed. You are hereby notified that any disclosure, copying, distribution or taking any action in reliance on the contents of this information is strictly prohibited and may be unlawful. Mayberry may effect transactions or have positions in securities mentioned herein. In addition, employees of Mayberry may have positions and effect transactions in the securities mentioned herein.


