May 10, 2022
NCB Financial Group Limited (NCBFG), for the six months ended March 31, 2022, booked a 19% increase in net interest income to total $32.38 billion relative to the $27.10 billion booked the corresponding period in 2021. NCBFG noted, “This reflects continued growth in lending and higher investment securities coupled with effective interest spread management.” For the second quarter ended March 31, 2022, net interest income rose 21% to close at $16.10 billion (2021: $13.29 billion). Interest income, for the period under review, rose to $44.51 billion compared to $40.22 billion in 2021, while interest expense amounted to $12.13 billion relative to $13.11 billion for the corresponding period in 2021.
Net fees and commission income amounted to $12.95 billion, an increase of 15% compared with the $11.31 billion booked for the six months ended March 31, 2021. For the quarter, net fees and commission income improved 20% to close at $6.53 billion (2021: $5.44 billion).
Dividend income increased by 37% to a total of $1.37 billion (2021: $993.81 million). Other operating income rose 177% to $3.60 billion (2021: $1.30 billion), while credit impairment losses decreased 9% to $2.30 billion in contrast to $2.53 billion recorded for 2021. Lastly, the Company’s gain on foreign currency and investment activities fell 36% to $5.40 billion compared to $8.42 billion reported in the corresponding period in 2021.
Consequently, NCBFG’s net results from banking and investment activities, for the six months ended March 31, 2022, climbed 15% to a total of $53.41 billion (2021: $46.60 billion). Meanwhile, for the second quarter ended March 31, 2022, Net results from banking and investment activities climbed 34% to a total of $28.70 billion (2021: $21.40 billion).
Net results from insurance activities for the six months ended March 31, 2022 rose by 21% to $15.93 billion (2021: $13.16 billion). Of this, insurance premium income rose 14% to $84.05 billion (2021: $73.56 billion), while reinsurance commission income fell to $5.71 billion (2021: $6.09 billion). Insurance premium ceded to insurers amounted to $26.21 billion (2021: $23.94 billion), while insurance benefits and claims amounted to $62.14 billion (2021: $36.73 billion), respectively. Commission and other selling expenses ended at $8.73 billion compared to $8.71 billion in 2021. Net results from insurance activities for the second quarter ended March 31, 2022 grew by 45% to $6.62 billion (2021: $4.57 billion).
Total operating expenses for the six months amounted to $51.73 billion, an increase of 10% compared to the $47.13 billion reported for the six months ended March 31, 2021. “There was a 5% rise in compensation related costs due to annual increases. Asset taxes increased due to the growth in the asset base. The Group also experienced higher expenses primarily related to the execution of various strategic initiatives as we strive to enhance customers’ service experience and our digital capabilities,” according to Management. Expenses for the quarter rose 15% to close at $24.76 billion compared to $21.57 billion in 2021. Of these expenses, for the six months ended March 31, 2022:
- Staff costs increased 5% to $24.56 billion relative to $23.36 billion in 2021.
- Other operating expenses grew by 17% to $21.37 billion (2021: $18.31 billion).
- Finance cost amounted to $949.73 million (2021: $850.89 million).
- Depreciation and amortization grew 5% to $4.85 billion (2021: $4.62 billion).
Notwithstanding, operating profit for the six months ended March 31, 2022, rose 39% to total $17.61 billion (2021: $12.63 billion). Meanwhile, for the quarter ended March 31, 2022, operating profit increased 140% to total $10.57 billion (2021: $4.41 billion).
Share of profit of associate, for the six months ended March 31, 2022, amounted to $488.41 million, up from 2021’s $50.71 million.
Consequently, profit before taxation for the six months ended March 31, 2022, rose 39% to $18.09 billion relative to $12.68 billion in 2021. The Group booked a taxation charge of $2.81 billion for the six months ended March 31, 2022 relative to a taxation charge of $3.44 billion in the corresponding period of 2021. As such, net profit for the six months ended March 31, 2022, rose by approximately 65% to $15.29 billion (2021: $9.24 billion). Tax charge for the second quarter amounted to $860.26 million compared to a credit of $1.14 billion in 2021. Net profit for the quarter closed at $9.91 billion (2021: $3.39 billion), representing a 192% increase.
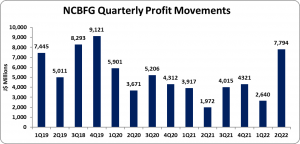
Net profit attributable to shareholders closed at $10.43 billion for the six months ended March 31, 2022 relative to $5.89 billion in 2021. Net profit attributable to shareholders for the quarter amounted to $7.79 billion (2021: $1.97 billion).
Total Comprehensive loss year to date amounted to $4.13 billion relative to an income of $9.61 billion for the same period in 2021. For the quarter, total comprehensive loss closed at $7.83 billion versus a loss of $3.57 billion for the corresponding quarter of 2021.
Earnings per share (EPS) for the six months totaled $4.23 relative to $2.39 booked for the comparable period of 2021. The EPS for the second quarter amounted to $3.16 (2021: $0.80). The twelve months earnings per share amounted to $7.61. The number of shares used in our calculations amounted to 2,466,762,828 units. NCBFG stock price closed the trading period at a price of $108.08 on May 9, 2022 with a corresponding P/E of 14.20x.
Balance Sheet at a glance:
Total Assets increased to $2.06 trillion as at March 31, 2022 relative to $1.85 trillion booked as at March 31, 2021. This increase stemmed mainly from the growth in ‘Investment securities’ and ‘Loans and Advances’ which closed at $728.98 billion (2021: $639.37 billion) and $555.89 billion (2021: $477.06 billion), respectively. Management noted, “The growth in the asset base continues to be bolstered by increased net loans, investment securities and amounts due from banks. The year over year growth was primarily funded by increased deposits, repurchase agreements, other borrowed funds, and liabilities under annuity and insurance contracts.”
‘Equity attributable to shareholders of the parent’ as at March 31, 2022 stood at $156.54 billion relative to $162.70 billion as at March 31, 2021. This resulted in book value per share of $63.46 (2021: $65.96).
Disclaimer:
Analyst Certification -The views expressed in this research report accurately reflect the personal views of Mayberry Investments Limited Research Department about those issuer (s) or securities as at the date of this report. Each research analyst (s) also certify that no part of their compensation was, is, or will be, directly or indirectly, related to the specific recommendation (s) or view (s) expressed by that research analyst in this research report.
Company Disclosure -The information contained herein has been obtained from sources believed to be reliable, however its accuracy and completeness cannot be guaranteed. You are hereby notified that any disclosure, copying, distribution or taking any action in reliance on the contents of this information is strictly prohibited and may be unlawful. Mayberry may affect transactions or have positions in securities mentioned herein. In addition, employees of Mayberry may have positions and effect transactions in the securities mentioned herein.


