
July 13, 2018
New Foreign Direct Investment in the United States: 2017
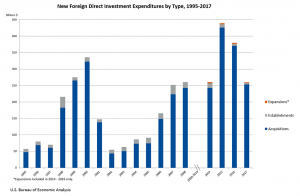
The U.S. Bureau of Economic Analysis indicated that, “Expenditures by foreign direct investors to acquire, establish, or expand U.S. businesses amounted to $259.6 billion (preliminary) in 2017.” In 2016, there was a decrease in expenditure by 32 percent from $379.7 billion (revised) which was below the annual average of $359.9 billion for 2014-2016. Additionally, majority of the total expenditures was accounted for in the acquisitions of existing businesses, as noted in previous years.
“In 2017, expenditures for acquisitions were $253.2 billion, expenditures to establish new U.S. businesses were $4.1 billion, and expenditures to expand existing foreign-owned businesses were $2.4 billion.” However, for projects initiated in 2017, planned total expenditures inclusive of first-year and planned future expenditures were $278 billion.
Expenditures by industry, country, and state in 2017
Expenditures in manufacturing accounted for the largest share among major industries as it was recorded at $103.7 billion, that is 40 percent of total expenditures. Food manufacturing was deemed the largest expenditures within the manufacturing industry at $34 billion while information expenditures and expenditure in real estate, rental and leasing were at $25.7 billion and $17 billion, respectively.
Notably, Canada was recorded as the largest investing country, with an expenditure of $66.2 billion, followed by the United Kingdom ($40.9 billion), Japan ($34.0 billion), and France ($23.1 billion).
In relation to region, in 2017, Europe contributed to 40 percent of the new investment. While, by U.S. state, the largest expenditures were in California ($41.6 billion), Texas ($39.7 billion), and Illinois ($26.0 billion).
The information contained herein has been obtained from sources believed to be reliable, however its accuracy and completeness cannot be guaranteed. You are hereby notified that any disclosure, copying, distribution or taking any Action in reliance on the contents of this information is strictly prohibited and may be unlawful. Mayberry may effect transactions or have positions in securities mentioned herein. In addition, employees of Mayberry may have positions and effect transactions in the securities mentioned herein.


