August 21, 2023
Pan Jamaica Group Limited (PJAM) for the six months ended June 30, 2023, reported a 946% increase in gross operating revenue totalling $9.97 billion compared to $953.97 million in the corresponding period last year. Gross operating revenue for the second quarter had a 1747% increase to close at $9.03 billion compared to $489.10 million for the comparable quarter of 2022. PJAM highlighted, “The notable shift in the Group’s earnings trajectory in the Second Quarter can be attributed to the successful amalgamation of the operating businesses of Jamaica Producers Group Limited with PanJam Investment Limited (“PanJam”). PanJam has since been renamed the Pan Jamaica Group Limited.”
Additionally, “The amalgamation became effective on 1 April 2023. As a result, the earnings profile in the Second Quarter is markedly different from the comparative period in the prior year. PJG, a multinational conglomerate boasting a diverse investment portfolio, has now strategically organized its operational structure into distinct segments, namely Property and Infrastructure, Financial Services, Speciality Foods, and Global Services.”
Cost of operating revenue amounted to $6.92 billion (2022: $495.62 million), this represents an increase of 1296% year over year. Consequently, gross profit increased by 567% to $3.06 billion compared to $458.34 million for the six months ended June 30, 2022. The company booked gross profit of $2.47 billion for the second quarter versus $221.78 million reported for the similar quarter of 2022.
Other income and expenses, net increased by 301% to close at $572.69 million (2022: $142.88 million).
Net investment expense decreased by 93% from $43.56 million in 2022 to $2.84 million in the period under review. Selling, administration and other operating expenses for the six months amounted to $2.91 billion, a 359% increase relative to $633.61 million reported in 2022.
Share of profits in associates and joint ventures for the six months ended June 30, 2023, amounted to $1.60 billion, a 59% increase relative to $1.00 billion reported in 2022. Share of profits in associates and joint ventures for the second quarter amounted to $922.04 million (2022: $1.23 billion).
Profit before finance costs and taxation for the six months amounted to $2.31 billion, a 150% increase relative to $927.11 million reported in 2022. Finance costs totalled $615.04 million, a 26% decrease from $489.20 million booked in corresponding period last year.
Profit before taxation for the six months ended June 30, 2023, amounted to $1.70 billion, a 288% increase relative to $437.91 million reported in 2022.
Following the 411% increase in taxation for the six months to $289.20 million (2022: $56.59 million), net profit amounted to $1.41 billion from the $381.32 million reported in 2022.
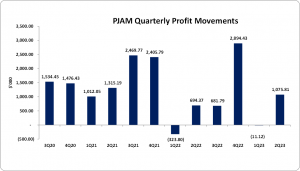
Net profit attributable to parent company shareholders for the six months ended June 30, 2023, amounted to $1.06 billion, a 187% increase relative to $370.58 million reported in 2022. For the second quarter, net profit attributable to parent company shareholders was $1.08 billion (2022: $694.37 million).
Earnings per share (EPS) for the six months amounted to $0.65 (2022: EPS: $0.23), while EPS for the quarter totalled $0.66 (2022: $0.43). The twelve-month trailing EPS was $3.34, and the number of shares used in these calculations was 1,627,725,023.
Notably, PJAM’s stock price closed the trading period on August 21, 2023, at a price of $43.20 with a corresponding P/E ratio of 12.93x.
Balance Sheet Highlights:
The company’s assets totalled $126.99 billion (2022: $55.61 billion). This 129% increase was largely due to property, plant and equipment, which grew 858% from $4.57 billion in 2022 to $43.83 billion in 2023.
Shareholder’s equity was $72.93 billion (2022: $39.91 billion), representing a book value per share of $44.80 (2022: $24.52).
Disclaimer:
Analyst Certification -The views expressed in this research report accurately reflect the personal views of Mayberry Investments Limited Research Department about those issuer (s) or securities as at the date of this report. Each research analyst (s) also certify that no part of their compensation was, is, or will be, directly or indirectly, related to the specific recommendation(s) or view (s) expressed by that research analyst in this research report.
Company Disclosure -The information contained herein has been obtained from sources believed to be reliable, however its accuracy and completeness cannot be guaranteed. You are hereby notified that any disclosure, copying, distribution or taking any action in reliance on the contents of this information is strictly prohibited and may be unlawful. Mayberry may effect transactions or have positions in securities mentioned herein. In addition, employees of Mayberry may have positions and effect transactions in the securities mentioned herein.


