
May 31, 2018
Reported in US$ (except where it is indicated otherwise)
Proven Investments Limited (PROVEN) for the year ended March 31, 2018 ended reported interest income of $28.49 million, an 18% or $4.34 million increase when compared with the $24.15 million reported for the same period in 2017. Total interest income for the quarter amounted to $7.40 million reflecting an increase of 36% over the $5.42 million achieved in the corresponding quarter of the previous year.
Interest expense for the period amounted to $8.10 million, a 16% decline when compared to the $9.65 million booked for the comparable period in the prior year. As such, net interest income for the year ended witnessed a 41% or $5.89 million increase to total $20.39 million relative to the $14.50 million in the corresponding period of the previous year.
Dividend income amounted to $807,000, a 41% decrease from the $1.36 million recorded in 2017, while Fees & Commission income increased by 114% to $5.08 million relative to $2.37 million in 2017. Net foreign exchange loss amounted to $444,000 relative to a gain of $1.90 million recorded in 2017.
Other income moved from $1.01 million to total $3.67 million for period a vast increase of 265%. Proven also booked an increase in pension management income to total $2.36 million, up from $1.97 million booked last year for the same time period. In addition, Net fair Value adjustments and realised gains of $4.29 million was booked (2017: $1.72 million).
Consequently, net revenue increased by 46% to total $36.15 million compared to $24.82 million recorded for the corresponding period in 2017. For the quarter, Net Revenue rose 113% to $10.51 million relative to $4.92 million in 2017.
Operating Expenses climbed by 20% for the period to total $24.54 million relative to $20.43 million in 2017. Of this,
- Administrative and General Expenses recorded a 14% increase to close at $8.87 million relative to $7.80 million documented for the prior year.
- Depreciation and Amortization increased 24% to $1.66 million (2017: $1.34 million)
- Preference Share Dividend declined 55% to $976,000 (2017: $2.18 million)
- Staff cost increased 4% for the period from $8.31 million in 2017 to $8.61 million.
- Impairment losses of loans and other assets climbed 97% to $2.27 million (2017: $1.16 million).
- Property Expense grossly increased 281%, to lcose the period at $2.16 million relative to $565,000 recorded in 2017.
Consequently, Operating Profit for the year rose 165% to $11.61 million (2017: $4.39 million). Operating profit for the period also increased 166% to $2.49 million relative to the loss of $3.75 million recorded in 2017.
Proven booked Gain on acquisition of subsidiary of $48,000 relative to the $8.03 million recorded in 2017.
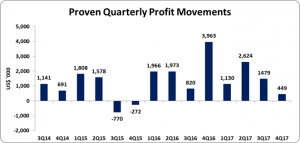
Profit before tax amounted to $11.66 million versus the $12.42 million booked in 2017. Taxation increased year over year by 209% from $697,000 to $2.15 million. As such, Net Profit amounted to $9.51 million, a 19% decline when compared to the $11.72 million in 2017. Proven booked profit for the quarter of $1.74 million compared to $4.50 million recorded for the comparable period in 2017.
Net profit attributable to shareholders for the period amounted to $5.68 million relative to $8.85 million in 2017. Profit attributable to shareholders for the quarter totaled $449,000 versus $4.09 booked in 2017.
Total comprehensive income for the period amounted to $6.30 million compared to $18.86 million for the corresponding period in 2017.
Earnings per share (EPS) for the quarter amounted to $0.07 cents (2017: $0.65 cents), while the EPS for the year ended amounted to $0.91 cents (2017: $1.42 cents). The number of shares used in our calculations is 625,307,963. Notably, the stock price for PROVEN and PROVENJA closed the trading period on February 8, 2018 at US$0.21 and $28.50 respectively.
Balance Sheet at a glance:
Total Assets as at March 31, 2018 to $576.91 million (2017: $633.33 million), a decline of 9%. This decline resulted from a $61.95 million decrease in Cash and Cash Equivalents to total $89.36 million (2017: $151.31 million) and a $14.12 million decline in Resale agreements to total $24.37 million (2017: $38.50 million).
Shareholders’ Equity totaled $107.35 million relative to $89.86 million in 2017; as such book value per share now amounts to $0.17 (2016: $0.14).
Disclaimer:
Analyst Certification -The views expressed in this research report accurately reflect the personal views of Mayberry Investments Limited Research Department about those issuer (s) or securities as at the date of this report. Each research analyst (s) also certify that no part of their compensation was, is, or will be, directly or indirectly, related to the specific recommendation (s) or view (s) expressed by that research analyst in this research report.
Company Disclosure -The information contained herein has been obtained from sources believed to be reliable, however its accuracy and completeness cannot be guaranteed. You are hereby notified that any disclosure, copying, distribution or taking any action in reliance on the contents of this information is strictly prohibited and may be unlawful. Mayberry may effect transactions or have positions in securities mentioned herein. In addition, employees of Mayberry may have positions and effect transactions in the securities mentioned herein.


