
May 16, 2018
Revenue totalled $4.95 billion compared to the $4.25 billion recorded for the same period of the prior financial year; this represents a 16.47% increase year over year.
Cost of Sales increased by 8.81% from $3.19 billion to $3.47 billion resulting in Gross Profits increasing by 39.57% to close at $1.48billion (2017: $1.06 billion).
Finance and Other Operating Income totalled $126.36 million relative to $182.77 million in 2017, a 30.86% decrease year over year.
Selling expenses decreased by 19.09% to close the first quarter of 2018 at $155.03million (2017: $191.61 million). Administrative Expenses for the period climbed by 53.68% to total $912.26million relative to $593.60 million. When contacted management explained that “ the first quarter results were bolstered by the transfer of the former Jamaican dairy operations of Nestle within the Group effective 1 January 2018.”
As such Operating Profit grew 17.64%, moving from $456.57 million for the first quarter of 2017 to a total of $537.12 million for comparable period in 2018.
Finance Costs totalled $139.10 million (2017: $69.85 million); a increase of 99.14% year over year. Share of Results of Joint Venture recorded a gain of $2.93 million compared to a loss of $17.75 million; this led to Profit before taxation increasing to $400.95 million in comparison to $368.97 million reported last year.
The company reported Net Profit of $292.90 million, a growth of 3.51% relative to last year’s corresponding period of $282.96 million, following taxation of $108.05million (2017: $86.01million).
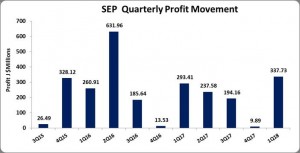
Net Profits attributable to shareholders amounted to $337.73 million, an improvement year on year from the $293.41 million recorded a year earlier.
Total comprehensive income attributed to shareholders amounted to $351.73 million versus $297.24 million recorded for the first three months of 2017.
Earnings per share for the quarter totalled $0.65 (2017: $0.57). The twelve months trailing EPS is $1.51. The number of shares used in this calculation was 516,397,918 shares. As at May 15, SEP stock was trading at $36.
Balance sheet at a Glance:
As at March 31, 2018, the company’s total assets increased by 9.52% to $19.33 billion from $17.65 billion a year ago. The increase in assets was largely due an improvement in inventory which increased by $705.72 million to total $2.88 billion (2017: $2.17 billion).
Shareholder equity for the period was $9.32billion relative to $9.26 billion last year a 0.58% increase. This resulted in a book value per share of $18.04 relative to $17.94 as at March 31, 2017.
Disclaimer:
Analyst Certification -This research report is for information purposes only and should not be construed as a recommendation. Each research analyst (s) also certify that no part of their compensation was, is, or will be, directly or indirectly, related to the specific recommendation (s) or view (s) expressed by that research analyst in this research report.
Company Disclosure -The information contained herein has been obtained from sources believed to be reliable, however its accuracy and completeness cannot be guaranteed. You are hereby notified that any disclosure, copying, distribution or taking any action in reliance on the contents of this information is strictly prohibited and may be unlawful. Mayberry may effect transactions or have positions in securities mentioned herein. In addition, employees of Mayberry may have positions and effect transactions in the securities mentioned herein.


