
April 29, 2020
Seprod Limited (SEP), for the year ended December 31, 2019, posted revenue totaling $32.70 billion compared to $22.50 billion recorded for the same period of the prior financial year, representing a 45% increase year over year. The Company stated, “This was driven primarily by the acquisition of the Facey Consumer Division in Q4 2018 and by an increase in the export business.” For the quarter, revenue climbed 1% closing at $7.90 billion relative to the $7.80 billion reported the prior year’s corresponding quarter.
Cost of Sales increased by 53% from $15.59 billion to $23.89 billion, resulting in gross profit increasing by 27% to close at $8.80 billion (2018: $6.91 billion). For the quarter ended December 31, 2019, gross loss closed at $223.33 million relative to $2 billion in the previous comparable period.
Finance and other operating income totaled $1.31 billion compared to $841.18 million in 2018, an increase of 56% year over year.
Administrative expenses and other operating expenses increased by 53% to close the year end period of 2019 at $6.89 billion (2018: $4.51 billion). However, selling expenses reduced by 37%, moving from $708.65 million in 2018 to $449.96 million in 2019. Net Impairment gain on Trade Receivables for the year ended December 31, 2019 amounted to $25 million versus net impairment losses on trade receivables of $57.83 million recorded in the prior corresponding period.
As such, operating profit grew 13%, moving from $2.48 billion to $2.80 billion to close the year end period of 2019. For the quarter, operating profit totaled $593.44 million (2018: $493.89 million).
Finance costs amounted to $1.47 billion (2018: $789.03 million), an increase of 87% year over year. For the quarter, finance cost closed at $606.29 million compared to $355.04 million in the prior comparative quarter. Share of results of joint venture amounted to $57.71 million in 2019 (2018: $57.93 million).
Profit before taxation declined to $1.39 billion in 2019, a 21% decrease on $1.75 billion reported a year prior.
Taxation credit, for the year ended December 31, 2019, amounted to $318.26 million relative to a taxation charge of $378.76 million booked in 2018.
Seprod reported net profit from continuing operations of $1.71 billion (2018: $1.37 billion), an increase of 24% year over year. Seprod noted that, “The increase in profits from continuing operations was due in large part to efficiencies gained from internal reorganizations of the ingredients and the distribution businesses, and from the consolidation of the dairy business.”
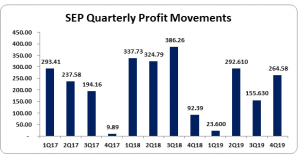
Net loss from discontinued operations amounted to $732.31 million (2018: $310.37 million). Net profit closed the year at $973.33 million relative to $1.06 billion reported twelve months earlier. Net profit for the quarter closed at $264.59 million versus $133.25 million booked for the corresponding quarter of 2018.
Total comprehensive income amounted to $1.07 billion relative to $1.18 billion in 2018.
Consequently, earnings per share (EPS) for the year ended December 31, 2019 amounted to $1.46 relative to $1.61 for the corresponding period in 2018. Earnings for the quarter amounted to $0.36 compared to $0.13 for the same quarter in 2018. SEP last traded on April 29, 2020 at $44.05.
The Company highlighted that “During 2019, Management executed on its previously communicated decision to close the sugar factory and, in so doing, curtail the ten (10) years of operational losses from sugar manufacturing. This move will positively impact the Group’s return on equity and its cashflows in the future. The losses from this discontinued operation (inclusive of redundancy payments and estimated impairment losses) amounted to J$814 million.
Balance sheet at a Glance:
As at December 31, 2019, the Company’s Total Assets increased by 3% to $36.50 billion from $35.30 billion a year ago. This increase was mainly due to increases in ‘Deferred tax asset’ and ‘Inventories’ by 85% and 6% respectively to $1.30 billion (2018: $702.77 million) and $6.91 billion (2018: $6.55 billion) .
Shareholders’ Equity as at December 31, 2019 amounted to $14.97 billion relative to $15.74 billion in 2018, indicating a 5% decrease. This translated into a book value per share of $20.41 (2018: $21.46).
Analyst Certification -The views expressed in this research report accurately reflect the personal views of Mayberry Investments Limited Research Department about those issuer (s) or securities as at the date of this report. Each research analyst (s) also certify that no part of their compensation was, is, or will be, directly or indirectly, related to the specific recommendation (s) or view (s) expressed by that research analyst in this research report.
Company Disclosure -The information contained herein has been obtained from sources believed to be reliable, however its accuracy and completeness cannot be guaranteed. You are hereby notified that any disclosure, copying, distribution or taking any action in reliance on the contents of this information is strictly prohibited and may be unlawful. Mayberry may effect transactions or have positions in securities mentioned herein. In addition, employees of Mayberry may have positions and effect transactions in the securities mentioned herein.


