
February 20, 2018
Seprod Limited (SEP), for the year ending December 31, 2017, reported Revenue of $16.21 billion compared to the $15.78 billion recorded for the prior financial year; this represents a 2.7% increase year over year. SEP noted, “the export segment delivered a 46% growth over prior year, despite some key markets being negatively impacted by the active hurricane season.” Revenue for the quarter totalled $4.07 billion a 13.11% decreased relative to $4.69 billion the prior year. The company also stated, “continued inability to stem the losses in the sugar operations. There were signs of turnaround but these were all wiped out by challenging weather conditions. The inability to even reach breakeven in this operation is a huge source of frustration and clearly will require added intervention to avoid further erosion of shareholder value.”
Cost of Sales declined by 3.2% from $12.29 billion to $11.90 billion. Consequently, Gross Profits improved 23.4% to close at $ 4.31 billion (2016: $3.49 billion). Gross profit for the quarter amounted to $1.36 billion compared to $1.11 billion booked for the fourth quarter of 2016.
Finance and Other Income for the year totalled $846.95 million relative to $1.05 billion in 2016 a 19.6% decline year over year.
Selling expenses increased by 11.6% to close the year at $658.34 million (2016: $589.83 million). Administrative Expenses for the year increased by 28.7% to total $3.04 billion (2016: $2.36 billion). As such, Operating Profit contracted by 8.5%, to total $1.45 billion (2016: $1.59 billion). Operating profit for the quarter increased 139.7% to close at $242.23 million relative to $101.05 million booked for the prior year’s corresponding quarter.
Finance Costs totalled $377.13 million; an increase of 0.7% compared $374.63 million in 2016. Share of results of joint venture amounted to a loss of $72.13 million versus a loss of $28.16 million recorded in 2016. As such, Pre-tax Profits declined 15.3% to $1 billion in comparison to profits of $1.19 billion last year.
Pre-tax Profits for the quarter amounted to $112.51 million compared to a loss of $65.17 million booked for the fourth quarter of 2016. Taxation of $295.15 million was booked for the financial year relative to $310.21 million in 2016. Net Profit for the year totalled $709.61 million (2016: $875.72 million), a 19% decline year over year. Net Profit for the quarter amounted to $126.81 million versus a loss of $67.51 million in 2016. SEP noted, “our net profit for 2017, as expected, is below 2016 primarily due to the one-off investment portfolio gain of j$360 million that occurred in the prior year. the gain in the investment portfolio was subsequently realized and a special dividend paid to shareholders in 2016.”
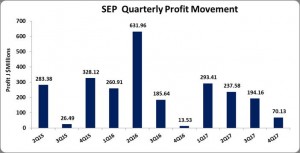
Net Profit attributable to shareholders totalled $795.29 million relative to $1.09 billion reported in 2016, while for the quarter SEP booked $70.13 million (2016: $13.53 million).
Earnings Per Share for the year ended December 31, 2017 amounted to $1.54 relative to $2.11 for the corresponding period in 2016. The EPS for the quarter totalled $0.14 compared to $0.03 booked in 2016. The closing price as at February 19, 2018 is $29.03. The number of shares used to calculate TTM is 516,397,918.
Management indicated, “the soap and bleach manufacturing operations, which did not fit within our core business, were divested. We will constantly be reviewing the business to look for opportunities to improve our focus and drive synergies to improve profitability.”
Balance Sheet at a Glance:
As at December 31, 2017, the company’s total assets increased by 16% to $20.22 billion from $17.43 billion a year earlier. The major contributor was a 55% increase in Trade and Other Receivables while closed the year at $6.18 billion relative to $3.99 billion in 2016.
Shareholder equity for the period was $9.35 billion relative to $9.19 billion last year. Book value per share is now $18.11 relative to $17.79 last year. The number of shares used in our calculations is 516,397,918.
The information contained herein has been obtained from sources believed to be reliable, however its accuracy and completeness cannot be guaranteed. You are hereby notified that any disclosure, copying, distribution or taking any action in reliance on the contents of this information is strictly prohibited and may be unlawful. Mayberry may effect transactions or have positions in securities mentioned herein. In addition, employees of Mayberry may have positions and effect transactions in the securities mentioned herein.

