
February 9, 2022
Seprod Limited (SEP) posted revenue totalling $42.91 billion compared to $37.74 billion recorded for the same period of the prior financial year, representing a 14% increase year over year. Revenue for the quarter amounted to $11.76 billion relative to the $9.08 billion reported in 2020.
Direct expenses increased by 17% from $27.25 billion to $31.90 billion, nonetheless, gross profit improved 5% to close at $11.01 billion (2020: $10.48 billion). For the quarter, gross profit closed the period at $2.89 billion (2020: $2.45 billion), a 19% increase when compared to the previous comparable period.
Other operating income totalled $1.25 billion compared to $1.73 billion in 2020, a 28% decline year over year. For the quarter, Other operating income declined by 27% to close at $1.09 billion (2020: $1.50 billion).
The Company reported nil for ‘Gain on sale of distribution facility’ for 2021 compared to $762.27 million recorded in 2020.
Other operating expenses rose 3% to close the period at $8.57 billion (2020: $8.30 billion).
As such, Operating profit fell 21%, moving from $4.68 billion in 2020 to $3.69 billion to close the year end period of 2021. For the quarter, operating profit totalled $888.58 million (2020: $869.70 million).
Finance costs amounted to $1.18 billion (2020: $1.27 billion), a 7% reduction year over year. For the quarter, finance cost closed at $442.92 million compared to $399.95 million in the prior comparative quarter.
Profit before taxation fell to $2.63 billion in 2021, a 23% decrease on $3.41 billion reported a year prior. Profit before taxation for the fourth quarter amounted to $470.01 million (2020: $478.77 million).
Seprod reported net profit from continuing operations of $2.14 billion (2020: $2.85 billion), a 25% decline year over year. Net profit from discontinued operations totaled $21.88 million versus the net profit of $23.03 million reported in 2020. The company noted, “This decline must be put in context as, in 2020, the Group recorded a one-off gain of J$762 million from the sale of a property. With the exception of this one-off gain, the unaudited full year profit for 2021 increased by J$47 million or 2% versus the corresponding period in 2020.”
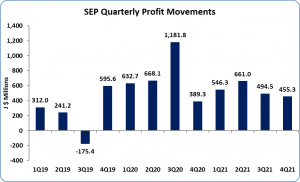
As a result, Net profit for the period amounted to $2.16 billion, 25% less than the $2.87 million reported in the prior year. For the quarter, net profit closed at $455.26 million (2020: $389.29 million).
Total comprehensive income closed at $2.51 billion (2020: $2.97 billion). For the quarter, total comprehensive income totalled $682.97 million (2020: $354.34 million).
Consequently, earnings per share (EPS) for the year ended December 31, 2021 amounted to $2.94 relative to $3.92 for the corresponding period in 2020. Earnings per share for the quarter amounted to $0.62 (2020: $0.53). The number of shares used in our calculations amounted to 733,546,855 units. SEP last traded on February 8, 2022 at $61.10 with a corresponding P/E ratio of 20.78 times.
The Company highlighted that “We had a devastating fire at Facey Merchandise’s distribution centre on October 9, 2021, that wiped-out over 86% of the finished goods inventory, which also included the Christmas stocks. This severely impacted the financial performance, as the well documented global supply chain challenges have limited the speed of replacement of the lost inventory. Our manufacturing entities have ramped up production, our principals in the distribution pillar did their best to supply, local stakeholders partnered with us to find and make functional alternative location for storage and our employees have simply been outstanding. While we lost billions of dollars of inventory and infrastructure (all adequately insured) we did not bow; indeed, we have started our recovery and we will emerge from this a more resilient, efficient, and committed organization with a strong growth trajectory.”
Balance Sheet at a Glance:
As at December 31, 2021, the Company’s Total Assets increased by 4% to $39.65 billion from $38.08 billion a year ago. Non-current assets closed at $21.53 billion (2020: $21.04 billion), while current assets amounted to $18.12 billion (2020: $17.04 billion). The overall increase was mainly attributable to a 26% increase in “Trade and Other Receivables” which amounted to $6.96 billion relative to the $5.52 billion reported twelve months prior. Inventories also grew 19% or $1.41 billion to close the year at $8.97 billion (2020: $7.56 billion).
Shareholders’ Equity as at December 31, 2021 amounted to $18.45 billion relative to $16.89 billion in 2020, indicating a 9% increase. This translated into a book value per share of $25.15 (2020: $23.03).
Disclaimer:
Analyst Certification -The views expressed in this research report accurately reflect the personal views of Mayberry Investments Limited Research Department about those issuer (s) or securities as at the date of this report. Each research analyst (s) also certify that no part of their compensation was, is, or will be, directly or indirectly, related to the specific recommendation(s) or view (s) expressed by that research analyst in this research report.
Company Disclosure -The information contained herein has been obtained from sources believed to be reliable, however its accuracy and completeness cannot be guaranteed. You are hereby notified that any disclosure, copying, distribution or taking any action in reliance on the contents of this information is strictly prohibited and may be unlawful. Mayberry may effect transactions or have positions in securities mentioned herein. In addition, employees of Mayberry may have positions and effect transactions in the securities mentioned herein


