Date: September 12, 2019
Scotia Group Jamaica Limited (SGJ) for the nine months ended July 30, 2019, Scotia Group Jamaica Limited’s (SGJ) Net Interest Income declined by 2% to $18.69 billion, moving from $19.12 billion for the corresponding period in 2018. Interest Income for the period decreased from $21.54 billion in 2018 to $20.67 billion while Interest Expenses declined by 18% to total $1.98 billion (2018:$2.42 billion).
The company reported an Impairment Loss on Loans of $1.92 billion compared to the loss of $1.17 billion for the comparable period in 2018. As such, Net Interest Income after Impairment losses on loans fell 7% to $16.77 billion relative to the $17.94 billion recorded for the corresponding period in 2018.
Total Other Revenue increased by 9% to $15.13 billion (2018: $13.92 billion). Of this:
-
- Net Fees and Commission Income amounted to $5.99 billion (2018: $6.11 billion), a decrease of 2% relative to the corresponding period in 2018. The performance was, “impacted by continuous customer education on alternatives to reduce fees, and the ongoing shift to online and mobile transactions which attract lower fees.”
- Insurance Revenue climbed by 7% and closed the period at $2.57 billion relative to $2.40 billion last year. SGJ noted, insurance revenue was impacted, “due mainly to higher premium income year over year, partially offset by lower actuarial reserve releases.”
- Net Foreign Currency Activities increased by 45% and amounted to $5.24 billion (2018: $3.61 billion), SGJ noted that this was, “due to increased market activities”.
- Net Gains on Financial Assets improved to $1.13 billion relative to $1.02 billion recorded in 2018.
- SGJ reported no Gain on disposal of subsidiary relative to $753.14 million in 2018 .
- Other revenue increased from $22.90 million to $211.45 million, an increase of 823%.
As such, Total Operating Income for the period increased marginally by 0.1% to total $31.90 billion versus $31.86 billion for the corresponding period in 2018. Total Operating Income for the quarter amounted to $11.15 billion, 4% higher than the $10.76 billion booked for the same quarter of 2018.
The company noted, “Total revenues excluding expected credit losses for the nine months ended July 31, 2019 was $33.8 billion, up $792 million or 2% above the comparative period last year. Excluding the one-off impact of gains from sale of subsidiary last year, total revenues grew by 5%. Loan and transaction volumes continued to grow across our business lines, however lower interest rates due to a stable macroeconomic environment and increased competition, resulted in margin compression. Net interest income after expected credit losses for the nine months period was $16.8 billion, down $1.2 billion or 7% when compared to the previous year.”
Total Operating Expenses for the nine months amounted to $18.38 billion, a 13% growth from the $16.26 billion booked for the corresponding period in the prior financial year. Management noted, “the growth in operating expenses was attributable to increased technology investments such as ATM software, online banking enhancements, security chips for credit cards and network upgrade to support our digital strategy”.
Under operating expenses:
-
- Salaries and Staff Benefits decreased to close the period at $8.35 billion (2018: $7.59 billion) “primarily due to increased incentives to our sales team resulting in the loan uptick, while other operating expenses grew by $1.2 billion”
- Property Expenses (Including Deprecation) rose by 8% amounting to $1.64 billion (2018: $1.51 billion).
- Amortization of Intangible Assets declined 2% to close the period at $114.32 million versus $116.21 million in 2018.
- SGJ reported $1.13 billion for asset tax, 4% more than the $1.09 billion documented for the same period for 2018. This was “due to the increase in the Group’s assets”.
- Other Operating Expenses increased by 20% and closed the period at $7.15 billion relative to $5.96 billion in 2018.
Profit before Taxation for the period totaled $13.52 billion; this represents a decline of 13% from the $15.60 billion recorded in 2018.
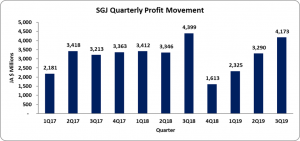
Tax charges for the period totaled $3.73 billion (2018: $4.44 billion), as such Net Profit for the period totaled $9.79 billion, 12% less than the $11.16 million posted for the same period in 2018. Profit for the quarter amounted to $4.17 billion, 5% less than the total of $4.40 billion a year earlier.
Profit attributable to shareholders for the period totaled $9.79 billion, a 12% decrease on the $11.16 billion recorded in 2018. Profit attributable to shareholders for the third quarter totaled $4.17 billion compared to $4.40 billion booked for the comparable period of 2018.
Earnings per share (EPS) for the period totaled $3.15 (2018: $3.59), while earnings per share for the quarter totaled $1.34 (2018: $1.41). The trailing earnings per share amounted to $3.66. The total number of shares employed in our calculations amounted to 3,111,572,984 units. Notably, SGJ’s stock price closed the trading period on September 11, 2019 at a price of $56.49.
Balance Sheet Highlights:
As at July 31, 2019, the company’s assets totaled $537.50 billion, 0.4% more than its value of $535.15 billion last year earlier. The marginal increase in total assets was primarily driven by increases in ‘Loans, After Allowances for Impairment Losses’ by $21.45 billion to total $198.43 billion and ‘Retirement Benefits Assets’ by $10.24 billion to a total of $39.29 billion but however tempered by the $18.27 billion decline in ‘Cash Resources’ to $127.46 billion (2018: $145.73 billion).
SGJ’s shareholders’ equity at the end of the period amounted to $116.18 billion relative to the $112.90 billion recorded in the prior year’s corresponding period. Consequently, the book value per amounts to $37.34 (2018: $36.29).
Analyst Certification -The views expressed in this research report accurately reflect the personal views of Mayberry Investments Limited Research Department about those issuer (s) or securities as at the date of this report. Each research analyst (s) also certify that no part of their compensation was, is, or will be, directly or indirectly, related to the specific recommendation (s) or view (s) expressed by that research analyst in this research report.
Company Disclosure -The information contained herein has been obtained from sources believed to be reliable, however its accuracy and completeness cannot be guaranteed. You are hereby notified that any disclosure, copying, distribution or taking any action in reliance on the contents of this information is strictly prohibited and may be unlawful. Mayberry may effect transactions or have positions in securities mentioned herein. In addition, employees of Mayberry may have positions and effect transactions in the securities mentioned herein.


