
September 11, 2023
Scotia Group Jamaica Limited (SGJ) for the nine months ended July 31, 2023, reported a 35% increase in Interest income totalling $29.24 billion compared to $21.70 billion in the corresponding period last year. Interest income for the third quarter had a 27% increase to close at $10.25 billion compared to $8.10 billion for the comparable quarter of 2022.
Interest expense amounted to $913.42 million (2022: $428 million), this represents an increase of 113% year over year. Consequently, net interest income increased by 33% to $28.33 billion compared to $21.28 billion in the prior year. The company booked net interest income of $9.84 billion for the third quarter versus $7.95 billion reported for the similar quarter of 2022.
Expected credit losses declined by 24% to close at $1.66 billion (2022: $2.18 billion), SGJ highlighted, “The Group’s credit quality remains strong, and we are well provisioned for both our performing and non-performing loans, ensuring adequate coverage for possible future non-performing loans”. Net interest income impairment losses on loans increased by 40% from $19.10 billion in 2022 to $26.67 billion in the period under review. As a result, total insurance finance expenses for the nine months amounted to $1.11 billion, relative to $1.12 billion reported in 2022.
Net insurance revenue amounted to $1.51 billion relative to $513.07 million reported a year prior, predominantly due to a 113% increase in insurance revenue closing at $1.83 billion. SGJ noted the increase was driven by, “higher contractual service margin, expected claims and insurance expense releases based on the performance of the portfolio, higher revenue generated from our Creditor Life portfolio given higher transaction volumes stemming from the further deepening of our customer relationships”.
Net fee and commission income for the period amounted to $5.84 billion, an increase of $1.2 billion or 24.8% given an increase in customer transactions and business activities.
Total operating income for the nine months amounted to $39.86 billion, a 36% increase relative to $29.38 billion reported in 2022. Total operating income for the third quarter amounted to $13.84 billion (2022: $10.78 billion).
Total operating expenses totalled $20.82 billion, an 11% increase from the corresponding period last year, “driven by higher technical support fees arising from the higher transaction volumes”, according to The Company.
Profit before taxation for the period amounted to $19.04 billion, an 80% increase relative to $10.60 billion reported in 2022. Profit before taxation for the third quarter amounted to $7.45 billion (2022: $4.96 billion).
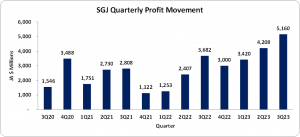
Taxation for the nine months had a 92% increase to reach $6.25 billion (2022: $3.26 billion). Net Profit for the nine months amounted to $12.79 billion, a 74% increase from the $7.34 billion reported in 2022. For the third quarter, Net Profit was $5.16 billion (2022: $3.68 billion).
Net profit attributable to shareholders for the nine months and third quarter closed at $12.79 billion and $5.16 billion, respectively.
Total comprehensive income closed at $9.40 billion (2022: loss of $5.25 billion). For the quarter, total comprehensive income of $5.62 (2022: loss of $7.24 billion).
Consequently, Earnings per share for the nine months amounted to $4.11 (2022: EPS: $2.36), while Earnings per share for the quarter totaled $1.66 (2022: EPS: $1.18). The twelve-month trailing EPS was $5.50, and the number of shares used in these calculations was 3,111,572,984.
Notably, SGJ’s stock price closed the trading period on September 08, 2023, at a price of $33.44 with a corresponding P/E ratio of 6.08x.
Balance Sheet Highlights
The company’s assets totalled $646.41 billion (2022: $590.56 billion). This was predominantly attributed to a $40.47 billion growth on SGJ’s loan portfolio which closed at $259.58 billion.
Shareholder’s equity was $113.84 billion (2022: $104.44 billion), representing a book value per share of $36.58 (2022: $33.56).
Disclaimer:
Analyst Certification -The views expressed in this research report accurately reflect the personal views of Mayberry Investments Limited Research Department about those issuer (s) or securities as at the date of this report. Each research analyst (s) also certify that no part of their compensation was, is, or will be, directly or indirectly, related to the specific recommendation (s) or view (s) expressed by that research analyst in this research report.
Company Disclosure -The information contained herein has been obtained from sources believed to be reliable, however its accuracy and completeness cannot be guaranteed. You are hereby notified that any disclosure, copying, distribution or taking any action in reliance on the contents of this information is strictly prohibited and may be unlawful. Mayberry may effect transactions or have positions in securities mentioned herein. In addition, employees of Mayberry may have positions and effect transactions in the securities mentioned herein.

