
June 9, 2022
Scotia Group Jamaica Limited (SGJ) reported an increase in Net Interest Income to $12.71 billion, moving from $11.30 billion for the corresponding period in 2021. Notably, Interest Income for the period increased from $12.25 billion in 2021 to $13.60 billion in the period under review. Interest Expense declined 6% to total $894.90 million (2021: $948.92 million). Net interest income for the quarter amounted to $6.55 billion relative to $5.51 billion reported in 2021. Management noted that the year to date increase of Net Interest Income was driven by “an increase in interest earned on the investment portfolio and improved retail loan volumes.”
The company reported Expected Credit Losses of $1.23 billion compared to a loss of $1.41 billion for the comparable period in 2021.
As such, Net Interest Income after Expected Credit Losses on loans rose 16% to $11.48 billion relative to the $9.90 billion recorded for the corresponding period in 2021.
Total Other Revenue declined by 17% to $8.47 billion versus $10.22 billion recorded for the six months ended April 30, 2022. Total other revenue is broken down as followed:
-
- Net Fees and Commission Income amounted to $3.26 billion (2021: $3.04 billion), a 7% increase relative to the corresponding period in 2021.
- Insurance Revenue rose 13% to closed the period at $1.50 billion relative to $1.33 billion last year.
- Net Foreign Currency Activities declined 26% to $3.37 billion from $4.55 billion booked for the six-months ended April 30,2021.
- Net Gains on Financial Assets went down to $49.69 million relative to $307.77 million recorded for the same period in 2021.
- Other revenue fell from $988.63 million in 2021 to $302.10 million booked for the comparable period in 2022.
Total Operating Income for the year to date decreased 1% to total $19.96 billion versus $20.11 billion for the corresponding period in 2021. Total Operating Income for the quarter amounted to $9.59 billion (2021: $9.31 billion), reflecting a 3% increase when compared to the comparable quarter last year.
Total Operating Expenses for the period amounted to $13.37 billion, a 0.1% growth from the $13.36 billion booked in 2021. As for the quarter, total expenses amounted to $5.97 billion, 7% increase year over year from the $5.59 billion reported in 2021.
Under operating expenses for the period:
-
- Salaries and Staff Benefits decreased to close the period at $5.01 billion (2021: $5.05 billion).
- Property Expenses (Including Depreciation) fell by 2% amounting to $1.17 billion (2021: $1.19 billion).
- Amortization of Intangible Assets decreased 7% to close the period at $45.48 million versus $48.98 million booked in 2021 corresponding period.
- SGJ reported asset tax of $1.32 billion, 8% more than the $1.22 billion documented for the first six months ended April 30, 2021.
- Other Operating Expenses decreased by 0.3% closing the period at $5.84 billion relative to $5.85 billion.
Profit before Taxation for the six months totaled $6.59 billion, this represents a 2% decline from the $6.76 billion recorded in 2021. For the quarter pre-tax profit declined by 3% to $3.63 billion (2021: $3.72 billion).
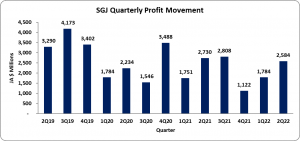
Tax charges for the six months totaled $2.22 billion (2021: $2.27 billion). As such, Net Profit for the period totaled $4.37 billion, 2% less than the $4.48 billion posted for the same period in 2021. Net profit for the second quarter closed at $2.58 billion relative to $2.73 billion for the same quarter of 2021.
Net profit attributable to shareholders amounted to $4.37 billion (2021: $4.48 billion). While for the quarter, net profit attributable to shareholders closed at $2.58 billion (2021: $2.73 billion).
Total Comprehensive income for the period amounted to $3.12 billion compared to an income of $10.33 billion in 2021. For the quarter, total comprehensive income amounted to $216.52 million relative to a total comprehensive income of $5.53 billion reported for the second quarter of 2021.
Earnings per share (EPS) for six months totaled $1.40 (2021: $1.44). EPS for the second quarter amounted to $0.83 versus $0.88 reported for the second quarter of 2021. The trailing twelve months EPS amounted to $2.67. The total number of shares employed in our calculations amounted to 3,111,572,984 units. Notably, SGJ’s stock price closed the trading period on June 8, 2022, at a price of $36.99 with a corresponding P/E of 13.87 times.
Balance Sheet Highlights:
As at April 30, 2022, the company’s assets totaled $604.37 billion (2021: $573.51 billion), 5% more than its value a year earlier. The increase in total assets was primarily driven by increases in ‘Cash Resources’ by $26.98 billion to total $162.78 billion (2021: $135.80 billion). ‘Investment Securities’ increased by $15.69 billion to a total of $161 billion (2021: $145.31 billion). The overall movement was reduced by a $6.67 billion decline in ‘Loans, After Allowances for Impairment Losses’ which closed at $208.02 billion (2021: $214.69 billion) and a $4.29 billion decline in ‘Retirement Benefits Assets’ to $35.20 billion (2021: $39.48 billion).
SGJ’s shareholders’ equity at the end of the period amounted to $114.55 billion relative to the $118.44 billion recorded in the prior year’s corresponding quarter. Consequently, the book value per amounts to $36.81 (2021: $38.06).
Disclaimer:
Analyst Certification -The views expressed in this research report accurately reflect the personal views of Mayberry Investments Limited Research Department about those issuer (s) or securities as at the date of this report. Each research analyst (s) also certify that no part of their compensation was, is, or will be, directly or indirectly, related to the specific recommendation (s) or view (s) expressed by that research analyst in this research report.
Company Disclosure -The information contained herein has been obtained from sources believed to be reliable, however its accuracy and completeness cannot be guaranteed. You are hereby notified that any disclosure, copying, distribution or taking any action in reliance on the contents of this information is strictly prohibited and may be unlawful. Mayberry may effect transactions or have positions in securities mentioned herein. In addition, employees of Mayberry may have positions and effect transactions in the securities mentioned herein.


