Total Revenues increased by 5% to $30.36 billion from $29 billion in 2016, while for the second quarter Total Revenues were down 1% to total 15.09 billion compared to 15.29 billion in 2016.Total revenue was broken down as follows:
Net premium revenue increased by 12% to a total of $17.41 billion compared to $15.61 billion last year.
Net Investment Income declined to $8.96 billion from $10.05 billion in 2016, an 11% decline.
Fees and other revenue increased 19% to $3.99 billion from $3.34 billion in 2016.
Benefits and Expenses totaled $23.60 billion for the period, a slight decline of 0.3% from $23.67 billion, while for the second quarter Benefits and Expenses were down 10% to close at $11.11 billion relative to $12.28 billion in 2016. This was mainly driven by increases in commission and related expense and administration expenses and a decline in Changes in insurance and annuity liabilities. Commission and related expenses grew by 15% to $2.38 billion from $2.07 billion while administration expenses increased by 31% to $9.27 billion (2016:$7.1 billion). The company highlighted that “the increases were influenced by business expansion – in particular the Cards and Payments business.” Changes in insurance and annuity liabilities decline by 86% to total $465.34 million relative to $3.26 billion in 2016.
Share of profit from joint venture amounted to $16.53 million relative to $10.96 million a year prior. Share of profit from associate for the period totaled $233.13 million compared to $329.43 million last year. As such, Profit before Taxation amounted to $7.01 billion, a 24% gain when compared to the $5.67 billion booked in 2016.
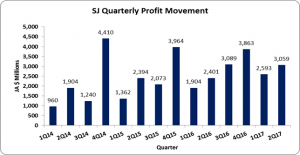
Investment and corporation taxes of $1.35 billion was reported for the period (2016: $1.37 billion), as such net profit for the six months totaled $5.65 billion (2016:$4.31 billion), an increase of 31%. Profit for the quarter amounted to $3.06 billion relative to $2.40 billion in 2016.
Earnings per share for the quarter amounted to $0.783 (2016:$0.615), while EPS for the period totaled $1.45 relative $1.10 in 2016. The twelve month trailing EPS amounted to $3.22.
Balance Sheet at a glance:
Total Assets increased by 6% or $17.80 billion to close at $340.21 billion as at June 30, 2017 from $322.40 billion the year prior.
Equity attributable to stockholders of the company as at June 30, 2017 stood at $59.82 billion (2016: $51.69 billion) resulting in book value per share of $15.32 (2016: $13.23). The number of shares used in our calculations amounted to 3,905,634,918 units.
Disclaimer:
Analyst Certification -The views expressed in this research report accurately reflect the personal views of Mayberry Investments Limited Research Department about those issuer (s) or securities as at the date of this report. Each research analyst (s) also certify that no part of their compensation was, is, or will be, directly or indirectly, related to the specific recommendation (s) or view (s) expressed by that research analyst in this research report.
Company Disclosure -The information contained herein has been obtained from sources believed to be reliable, however its accuracy and completeness cannot be guaranteed. You are hereby notified that any disclosure, copying, distribution or taking any action in reliance on the contents of this information is strictly prohibited and may be unlawful. Mayberry may effect transactions or have positions in securities mentioned herein. In addition, employees of Mayberry may have positions and effect transactions in the securities mentioned herein.