Sagicor Group Jamaica Limited (SJ) for the nine months ended September 30, 2017 reported an 18% increase total revenues to $53.53 billion from $45.33 billion in 2016, while for the third quarter Total Revenues were up 42% to total $23.18 billion compared to $16.32 billion in 2016.Total revenue was broken down as follows;
- Net premium revenue increased by 27% to a total of $31.82 billion compared to $24.99 billion last year.
- Net Investment Income decreased slightly to $15.48 billion from $15.56 billion in 2016, a 0.49% decline.
- Fees and other revenue increased 30% to $6.24 billion from $4.78 billion in 2016.
The company stated, “with respect to the Individual lines of business, earned premiums were higher by 12%, while Group Insurance and Annuities premiums were up significantly, especially with new business closed in Q3. Investment income before interest expense and capital gains of $15.44 billion was 5% higher than in 2016. We experienced lower yields on invested assets in the period. Realized capital gains from securities trading were substantially below prior year, affected by impairment charges and realized losses on certain securities sold. Fees and Other Revenues of $6.24 billion increased over the prior year by 30% with the expansion of our Cards and Payments business. Overall revenue growth stemmed primarily from business expansion.”
Benefits and Expenses totalled $43.12 billion for the period, an increase of 18% from $36.48 billion, while for the third quarter Benefits and Expenses were up 52% to close at $19.52 billion relative to $12.80 billion in 2016. The growth was mainly driven by increases in commission and related expense, administration expenses and changes in insurance and annuity liabilities. Commission and related expenses grew by 12% to $3.54 billion from $3.16 billion while administration expenses increased by 23% to $13.32 billion (2016: $10.82 billion). The company highlighted that “This increase is mainly influenced by business expansion – in particular the Cards and Payments business; compensation cost for annual increases and bonuses to Team members some of which will not repeat later in the year; and higher credit losses in the Retail Banking Division.” Changes in insurance and annuity liabilities moved from $5.84 billion in 2016 to $8.74 billion for the nine months ended September 30, 2017.
Share of profit from joint venture amounted to $24.01 million relative to $16.30 million a year earlier. Share of profit from associate for the period totalled $749.12 million compared to $494 million last year. SJ indicated, “The Group also benefitted from the performance of the associate company, Sagicor Real Estate X-Fund”. As such, Profit before Taxation amounted to $11.19 billion, a 19% gain when compared to the $9.36 billion booked in 2016.
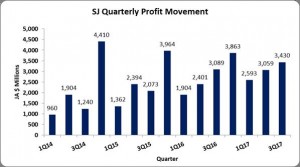
Investment and corporation taxes of $2.10 billion was reported for the period (2016: $1.97 billion), as such net profit for the nine months totalled $9.08 billion (2016: $7.39 billion), an increase of 23%. Profit for the quarter amounted to $3.43 billion relative to $3.09 billion in 2016.
Earnings per share for the quarter amounted to $0.878 (2016: $0.791), while EPS for the period totaled $2.33 relative $1.89 in 2016. The twelve month trailing EPS amounted to $3.31.
Balance Sheet at a glance:
Total Assets increased by 4% or $12.58 billion to close at $363.26 billion as at September 30, 2017 from $350.68 billion the year prior. The movement was attributed to a $9.43 billion increase in ‘Financial Investments’ which closed at $235.84 billion (2016: $226.41 billion). ‘Loans & leases, after allowance for credit losses’ increased 9% to $57.12 billion (2016: $52.47 billion), while ‘Investment in associated company’ totaled $7.64 billion (2016: $5.37 billion).
Equity attributable to stockholders of the company as at September 30, 2017 stood at $64.55 billion (2016: $56.60 billion) resulting in book value per share of $16.53 (2016: $14.49). The number of shares used in our calculations amounted to 3,905,634,918 units.

The information contained herein has been obtained from sources believed to be reliable, however its accuracy and completeness cannot be guaranteed. You are hereby notified that any disclosure, copying, distribution or taking any action in reliance on the contents of this information is strictly prohibited and may be unlawful. Mayberry may effect transactions or have positions in securities mentioned herein. In addition, employees of Mayberry may have positions and effect transactions in the securities mentioned herein.
