
November 12, 2021
Sagicor Group Jamaica (SJ), for the nine months ended September 30, 2021 reported a 22% increase total revenues to $73.15 billion from $60.20 billion in 2020, while for the third quarter total revenues went up 17% to total $24.95 billion compared to $21.35 billion in 2020. Total revenue for the nine months was broken down as follows:
- Net premium revenue increased by 3% to a total of $38.20 billion compared to $37.25 billion last year.
- Net investment income rose to $14.34 billion from $13.31 billion in 2021, resulting in an 8% increase year over year.
- Fees and other revenue increased 20% to $12.44 billion from $10.32 billion in 2020.
- Hotel Revenue stood at $3.03 billion for the period under review versus the $1.85 billion booked in 2020.
- Realised and unrealised capital gain amounted to $5.33 billion, relative to a loss of $759.91 million book the prior year. The $6.09 billion improvement in Realised and Unrealised Gains was “that were driven by price recovery in marketable securities and an increase in activity in the securities trading markets,” noted Management.
- The Company booked a credit loss of $189.45 million on loans and investment securities (2020: $1.78 billion)
Benefits and expenses totalled $56.00 billion for the period, up 26% from $44.40 billion, while for the third quarter benefits and expenses climbed 11% to close at $14.81 billion relative to $13.36 billion in 2020. Of this:
- Commission and related expenses grew by 14% to $5.31 billion from $4.65 billion in 2020.
- Administration expenses increased by 10% to $17.44 billion (2020: $15.83 billion).
- Net insurance benefits incurred amounted to $25.22 billion versus $24.41 billion that was recorded last year.
- Other taxes and levies totalled $825.73 million, an 11% increase relative to $746.75 million.
- Amortization and depreciation declined 8% from $2.19 billion in 2020 to $2.02 billion.
- Hotel Expenses totalled $2.38 billion (2020: $1.61 billion) for the period under review and Net movement in actuarial liabilities amounted to $2.81 billion, relative to a gain of 5.05 billion booked September 2020.
Share of profit from joint venture amounted to $705.10 million relative to $193.01 million reported a year earlier. Share of loss from associate for the period totalled $233.09 million compared to a loss of $388.15 million last year.
As such, Profit before Taxation amounted to $17.62 billion, an 87% increase when compared to the $9.41 billion booked in 2020. For the quarter, profit before taxation closed at $10.35 billion (2020: $6.36 billion).
Investment and corporation taxes of $4.07 billion was reported for the period (2020: $4.41 billion), as such net profit for the nine months totalled $13.55 billion (2020: $5.00 billion). Profit for the quarter amounted to $8.26 billion relative to $4.13 billion in 2020, a 100% year over year increase.
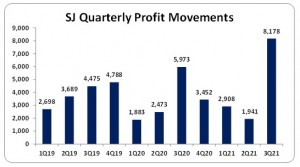
Net profit attributable to shareholders for the period amounted to $13.03 billion relative to $10.33 billion the prior year’s period. For the quarter, net profit attributable to shareholders increased 37% to $8.18 billion (2020: $5.97 billion).
Total comprehensive income for the period under review at $10.62 billion (2020: $6.53 billion), while for the quarter, total comprehensive income totalled $8.48 billion (2021: $4.46 billion).
Earnings per share for the quarter amounted to $2.094 (2020: $1.529), while EPS for the period totalled $3.335 relative to an EPS of $2.645 in 2020. The twelve-month trailing EPS amounted to $4.22.
The total number of shares used in the calculations amounted to 3,905,634,918 units. SJ’s stock last traded on November 12, 2021 at $53.88 with a corresponding P/E of 12.77 times.
According to SJ “the Individual Life insurance segment reported strong results underpinned by new business sales and portfolio growth. The commercial and investment banking segments benefited from the partial market rebound, experiencing improved transaction volumes and resulting fee income.”
Balance Sheet Highlights:
Total Assets increased by 7% or $31.56 billion to close at $512.92 billion as at September 30, 2021 up from $481.36 billion the year prior. The movement was attributed to a $33.53 billion increase in ‘Financial investments’ to $228.30 billion (2020: $194.76 billion).
Equity attributable to stockholders of the company as at September 30, 2021 stood at $114.31 billion (2020: $101.21 billion) resulting in book value per share of $29.27 (2020: $25.91).
Disclaimer:
Analyst Certification -The views expressed in this research report accurately reflect the personal views of Mayberry Investments Limited Research Department about those issuer (s) or securities as at the date of this report. Each research analyst (s) also certify that no part of their compensation was, is, or will be, directly or indirectly, related to the specific recommendation(s) or view (s) expressed by that research analyst in this research report.
Company Disclosure -The information contained herein has been obtained from sources believed to be reliable, however its accuracy and completeness cannot be guaranteed. You are hereby notified that any disclosure, copying, distribution or taking any action in reliance on the contents of this information is strictly prohibited and may be unlawful. Mayberry may effect transactions or have positions in securities mentioned herein. In addition, employees of Mayberry may have positions and effect transactions in the securities mentioned herein.

