
May 10, 2022
Sagicor Group Jamaica Limited (SJ) for the three months ended March 31, 2022, reported an increase in total revenues by 3% to $23.76 billion from $23.12 billion in 2021. Total revenue is broken down as follows:
-
- Net premium revenue rose by 5% to close at $13.12 billion compared to $12.52 billion documented 2021.
- Net investment income increased to $5.44 billion from $4.64 billion in 2021.
-
- Realized and unrealized capital loss closed at $393.28 million versus 2021’s gain of $1.20 billion.
- Credit losses on loans and investments securities amounted to $197.70 million, when compared to 2021’s $59.42 million.
-
- Fees and other revenue decreased 1% to $4.07 billion (2021: $4.10 billion).
- Hotel revenue of $1.72 billion was booked for the period relative to $721.02 million for the prior year.
Benefits and expenses totalled $18.45 billion for the quarter, a year over year decrease of 3% from $19.07 billion. The movement in benefits and expenses was mainly driven by:
-
- Administration expenses for the period amounted to $6.44 billion compared to $5.55 billion in the prior year, a 16% increase.
-
- A 15% increase in net insurance benefits incurred to $9.07 billion (2021: $7.90 billion).
-
- Commission and related expenses rose by 7% to close at $1.96 billion up from the $1.82 billion posted in 2021.
-
- Depreciation and amortization amounted to $683.06 million (2021: $660.54 million), a 3% increase.
-
- Asset tax moved up by 8% to close at $877.26 million in 2022 from $812.64 million in 2021.
-
- SJ also booked hotel expenses, which went up by 92% to close at $1.19 billion relative to $618.95 million booked the prior year.
-
- Net movement in actuarial liabilities amounted to $1.75 billion relative to an actuarial benefit of $1.71 billion booked in 2021’s first quarter.
Share of profit from joint venture amounted to $213.70 million relative to a profit of $222.50 million the prior year.
Profit before taxation amounted to $5.52 billion, a 37% increase when compared to the $4.04 billion booked in 2021.
After taxes of $1.50 billion (2021: $1.13 billion), net profit amounted to $4.02 billion (2021: $2.90 billion), an increase of 38%.
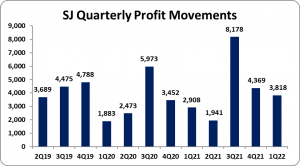
Profit attributable to shareholders amounted to $3.82 billion relative to $2.91 billion booked in 2021. As a result, EPS for the quarter amounted to $0.98 (2021: $0.74), while the twelve-month trailing EPS totalled $4.69. The number of shares used in our calculations amounted to 3,905,634,918 units. SJ’s stock price closed on May 9, 2022, at $55.07 with a corresponding P/E of 11.75 times.
Management advised that “Fees and other income also increased compared to prior year’s first quarter, attributable primarily to increase in fees from commercial banking activities and steady recovery in fees from assets under management. Volatility in equity markets, declining debt security prices and other unfavorable market trading conditions, resulted in a fair value loss of $393.28 million (March 2021: $1.20 billion gain).”
In the Commercial Banking segment, SJ noted, “The segment’s results included a 14% or $481.09 million increase in revenues, anchored by strong performances in fee income and net investment income. Net investment income of $2.72 billion was 8% higher than prior year, the result of a larger base of loans. Fee income of $1.41 billion was 39% higher than prior year due to higher credit card and point of sale fees, driven by increases in consumer spending.”
Management also stated that, “The segment was adversely impacted by unfavorable trading conditions and market volatility. Consequently, capital gains of $85.08 million were 79% less than prior year. The segment continued to benefit from growth in its interest earning assets base, which resulted in a 27%, or $305.99 million increase in net investment income.”
Balance Sheet at a glance:
Total assets increased by 9% or $41.64 billion to close at $525.36 billion as at March 31, 2022, from $483.71 billion the year prior. The main contributors to the increase in total assets were ‘Financial Investments’, ‘Loans & Leases after Allowance for Credit Losses’ and ‘Other Assets’ which closed at $238.11 billion (2021: $220.41 billion), $97.23 billion (2021:$87.30 billion) and $24.10 billion (2021: $20.84 billion), respectively.
Equity attributable to stockholders of the company as at March 31, 2022, stood at $109.46 billion (2021: $105.92 billion) resulting in book value per share of $28.03 (2021: $27.12).
Disclaimer:
Analyst Certification -The views expressed in this research report accurately reflect the personal views of Mayberry Investments Limited Research Department about those issuer (s) or securities as at the date of this report. Each research analyst (s) also certify that no part of their compensation was, is, or will be, directly or indirectly, related to the specific recommendation (s) or view (s) expressed by that research analyst in this research report.
Company Disclosure -The information contained herein has been obtained from sources believed to be reliable, however its accuracy and completeness cannot be guaranteed. You are hereby notified that any disclosure, copying, distribution or taking any action in reliance on the contents of this information is strictly prohibited and may be unlawful. Mayberry may affect transactions or have positions in securities mentioned herein. In addition, employees of Mayberry may have positions and effect transactions in the securities mentioned herein


