Sagicor Group Jamaica Limited (SJ) for the three months ended March 31, 2020, reported a decline in total revenues by 16% to $16.81 billion from $20.12 billion in 2019. Total revenue is broken down as follows:
-
- Net premium revenue went up by 24% to close at 12.85 billion compared to $10.36 billion documented 2019. Management noted, “The Group’s Insurance businesses have seen strong new business and portfolio growth resulting in net premium income and fee income being 24%”.
- Net investment income increased to $4.49 billion from $3.87 billion in 2019.
- Realized and unrealized capital loss closed at $5.06 billion versus 2019’s gain of $1.47 billion. SJ noted that, “Significant unrealized capital losses driven by the broad decline in bond and equity prices.”
- Credit losses on loans and investments securities amounted to $720.76 million, a 1164% increase when compared to 2019’s $57.02 million.
- Fees and other revenue increased 30% to $3.90 billion (2019: $3.01 billion). SJ noted, “due to strong growth in the Bank’s Payments channels business. The Group benefited from realized foreign currency trading gains and unrealized gains from the revaluation of foreign currency denominated assets, net of liabilities.”
- Hotel revenue of $1.35 billion was booked for the period relative to $1.47 million for the prior year. SJ highlighted, “Hotel revenue had been on an upward trend until the latter part of the quarter, when the effects of travel restrictions were keenly felt.”
Benefits and expenses totaled $12.91 billion for the quarter, a year over year decrease of 21% from $16.45 billion. The movement in benefits and expenses was mainly driven by;
-
- Administration expenses for the period amounted to $5.76 billion compared to $4.64 billion in the prior year, a 24% increase.
- A 38% increase in net insurance benefits incurred to $8.95 billion (2019: $6.49 billion).
- Commission and related expenses rose by 17% to close at $1.72 billion up from the $1.46 billion posted in 2019.
- Amortization of intangible assets amounted to $227.24million (2019: $183 million), a 24% increase.
- Asset tax moved up by 13% to close at $723.94 million in 2019 from $641.49 million in 2019.
- SJ also booked Hotel expenses which went down by 4% to close at $923.96 million relative to $964.80 million booked the prior year.
- Net movement in actuarial liabilities amounted to -$5.52 billion relative $1.94 billion booked in 2019’s first quarter.
- Amortization of lease liabilities closed at $137.58 million for the quarter ( 2019: 117.70 million), an 17% increase when compared to the corresponding quarter.
SJ booked $460.95 million for Impairment of investment in associate (2019: nil), and an Impairment of goodwill of $703.50 million (2019: nil).
Share of profit from joint venture amounted to $65.64 million relative to a loss of $4.62 million the prior year. Share of loss from associates totaled $474.05 million relative to a profit of $856.98 million last year.
Profit before taxation amounted to $2.33 billion, a 49% reduction when compared to the $4.53 billion booked in 2019.
After taxes of $1.18 billion (2019: $1.03 billion), net profit amounted to $1.14 billion (2019: $3.50 billion), a decrease of 67%.
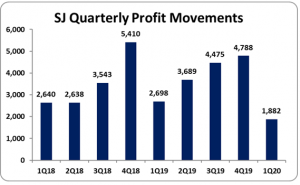
Profit attributable to shareholders amounted to $1.88 billion relative to $2.70 billion booked in 2019. As a result, EPS for the quarter amounted to $0.48 (2019: $0.69), while the twelve-month trailing EPS totaled $ 3.80. The number of shares used in our calculations amounted to 3,905,634,918 units. SJ’s stock price closed on May 15, 2020, at $45.48.
Balance Sheet at a glance:
Total assets increased by 13% or $52.13 billion to close at $458.46 billion as at March 31, 2020, from $406.32 billion the year prior. The main contributors to the increase in total assets were ‘Loans & leases, after allowance for credit loss’, ‘Cash resources’ and ‘Pledged assets’ which closed at $90.26 billion (2019: $71.90 billion), $33.22 billion (2019: $24.90 billion) and $78.31 billion (2019: $70.49 billion), respectively. .
Equity attributable to stockholders of the company as at March 31, 2020, stood at $87.09 billion (2019: $79.49 billion) resulting in book value per share of $22.30 (2019: $20.35).
Analyst Certification -The views expressed in this research report accurately reflect the personal views of Mayberry Investments Limited Research Department about those issuer(s) or securities as at the date of this report. Each research analyst (s) also certify that no part of their compensation was, is, or will be, directly or indirectly, related to the specific recommendation(s) or view(s) expressed by that research analyst in this research report.
Company Disclosure -The information contained herein has been obtained from sources believed to be reliable, however its accuracy and completeness cannot be guaranteed. You are hereby notified that any disclosure, copying, distribution or taking any action in reliance on the contents of this information is strictly prohibited and may be unlawful. Mayberry may effect transactions or have positions in securities mentioned herein. In addition, employees of Mayberry may have positions and effect transactions in the securities mentioned herein.


