

Date: August 09, 2019
SOS reported six months revenue of $638.55 million relative to $519.21 million in 2018, a 23% increase, while for the second quarter revenues amounted to $295.08 million up 23% compared to the $240.03 million reported in the corresponding period of 2018.
Management noted that, “it should be noted that during this quarter the sales of Seek products continued to grow moving from $4.3M in sales for the quarter in 2018 to $13.7M in 2019, an increase of 220%.”
In addition, “during the 2nd quarter SOS also exported its second container for the year which was shipped to Antigua to furnish the offices for a new hotel being constructed in that island,” SOS highlighted.
The Company’s cost of sales totaled $316.39 million up 22% relative to the $259.62 million reported in 2018. Cost of sales, for the quarter, rose by 19% to $141.35 million (2018: $118.72 million). As a result, gross profit grew by 24% for the six months amounting to $322.16 million relative to the $259.59 million booked in 2018, while gross profit for the quarter totaled $153.73 million (2018: $121.31 million).
Administrative expenses totaled $157.61 million up 11% compared to the $142.37 million booked in 2018, while selling and promotion expenses grew by 9% closing the period at $48.33 million relative to the $44.45 million reported in 2018. For the quarter, Administrative expenses went up by 5% to $80.42 million (2018: $76.75 million), while selling and promotion expenses closed at $25.26 million (2018: $22.24 million), a 14% growth year over year.
The company’s depreciation cost amounted to $16.95 million an increase of 44% relative to the $11.76 million incurred in 2018, while finance cost closed at $7.75 million (2018: $4.70 million).
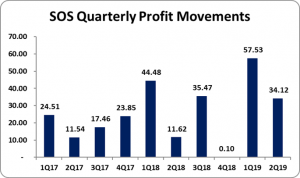
Profit before taxes grew by 63% amounting to $91.65 million relative to the $56.17 million earned in 2018. For the quarter, there was a pre-tax profit of $34.12 million (2018: $11.62 million).
No income tax expense was incurred (2018: $60,000), as such net profit for the period totaled $91.65 million an increase of 63% relative to the $56.11 million reported in 2018. Net profit for the quarter amounted to $34.12 million, up from the $11.62 million earned in 2018.
Earnings per share for the period amounted to $0.37 (2018: $0.22), while EPS for the quarter totaled $0.14 (2018: $0.05). The twelve-month trailing EPS amounted to $0.51. As at August 08, 2019, the stock traded at $12.00.
Balance Sheet at a glance:
Total Assets increased by 12% to close at $876.05 million as at June 30, 2019 from $778.98 million the year prior. The growth stemmed from a 8% growth in Property, Plant & Equipment to $383.52 million (2018: $354.84 million). Trade and other receivables also contributed to the increase to close at $153.65 million relative to $107 million recorded twelve months earlier. Inventories rose 16% from $177.66 million in 2017 to $206.71 million in 2019.
Equity attributable to stockholders of the company as at June 30, 2019 stood at $573.74 million (2018: $459.86 million). This resulted in a book value per share of $2.29 (2018: $1.84).
Analyst Certification -This research report is for information purposes only and should not be construed as a recommendation. Each research analyst (s) also certify that no part of their compensation was, is, or will be, directly or indirectly, related to the specific recommendation (s) or view (s) expressed by that research analyst in this research report.
Company Disclosure -The information contained herein has been obtained from sources believed to be reliable, however its accuracy and completeness cannot be guaranteed. You are hereby notified that any disclosure, copying, distribution or taking any action in reliance on the contents of this information is strictly prohibited and may be unlawful. Mayberry may effect transactions or have positions in securities mentioned herein. In addition, employees of Mayberry may have positions and effect transactions in the securities mentioned herein.