
August 03, 2021
tTech Limited (tTech), for the six months ended June 30, 2021, booked a 20% increase in revenues to $204.34 million compared to $170.28 million recorded for the prior financial year. Revenue for the quarter increased by 31% to 107.97 million compared to $82.73 million in 2020.
Cost of sales rose by 23% to $66.28 million from the $53.68 million reported for the six months ended June 30, 2020. Gross profit climbed 18% for the period to $138.06 million (2020: $116.60 million). Gross profit for the quarter amounted to $73.09 million versus $56.02 million for the second quarter ended June 30, 2020.
Other income totaled $1.89 million year to date relative to other income of $664,000 in 2020, while administrative expenses rose 20% year over year to $117.96 million (2020: $98.40 million). Other operating expenses for the period reflected a 6% contraction year over year to $12.22 million compared to $13.03 million recorded in 2020.
Operating profit year to date totaled $9.78 million, up from $5.83 million booked for the same period in 2020. Operating profit for the quarter closed at $4.88 million compared to $4.67 million reported for the three months ended June 30, 2020. TTECH booked finance income for the six months of $992,000 compared to $1.09 million recorded in the prior year’s corresponding quarter.
Whereas, finance cost amounted to $1.16 million (2020: $1.21 million) for the six months ended June 30, 2021.
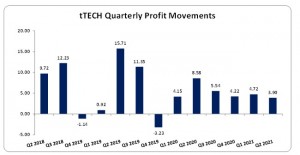
Taxation of $997,000 (2020: nil) were recorded for the period, thus net profit for the period amounted to $8.62 million versus $5.71 million booked for the same period of 2020. Net profit for the quarter amounted to $3.90 million (2020: $4.59 million), down 15% year over year.
Total Comprehensive income year to date amounted to $15.62 million (2020: $12.73 million), while for the second quarter comprehensive income totaled $7.57 million (2020: $8.58 million).
Earnings per share for the six months period amounted to $0.15 (2020: $0.12). The earnings per share (EPS) for the quarter amounted to $0.07 (2020: $0.08). The trailing twelve months EPS amounted to $0.24. The number of shares used in our calculations is 106,000,000 units. The Company’s stock price closed the trading period on August 03, 2021 at $4.40 with a corresponding P/E of 18.38 times.
tTech noted, “tTech has now entered phase two of the Junior Market incentive scheme where 50% of the normal tax rate equivalent to 12.5%, now applies to our profits during the second five years of listing on the Junior Market of the Jamaica Stock Exchange; after which the normal rate of 25% will apply. We are eligible for the Employment Tax Credit which will further reduce the rates payable to 8.75% for the next 5 years and 17.5% thereafter.”
Furthermore, “during the period under review, tTech continued to benefit from the momentum in Q1 with the addition of several Cybersecurity related projects to our roster. This is because we have been relentless in our Cybersecurity awareness activities which has driven some entities to act. We also continued our Data Protection as a Service campaign which has strengthened our pipeline. Also contributing positively was our highly successful business technology event, TechCon, that was held virtually this year on May 18‐19,” as per tTech.
Balance Sheet Highlights:
As at June 30, 2021, the Company reported total assets of $341.16 million, a 18% increase when compared to $317.69 million in 2020. This was as a result of a 32% increase in ‘Accounts Receivable’ which close at $86.14 million (2020: $65.32 million). ‘Inventory’ also contributed to the increase in the Company’s asset base by increasing to $43.94 million (2020: $31.74 million), reflecting a 38% year over year increase.
Shareholders’ Equity, as at June 30, 2021, was $249.23 million compared to $229.47 million for the comparable period of 2020. This resulted in a book value per share of $2.35 compared to $2.16 the prior year.
Disclaimer:
Analyst Certification -The views expressed in this research report accurately reflect the personal views of Mayberry Investments Limited Research Department about those issuer (s) or securities as at the date of this report. Each research analyst (s) also certify that no part of their compensation was, is, or will be, directly or indirectly, related to the specific recommendation (s) or view (s) expressed by that research analyst in this research report.
Company Disclosure -The information contained herein has been obtained from sources believed to be reliable, however its accuracy and completeness cannot be guaranteed. You are hereby notified that any disclosure, copying, distribution or taking any action in reliance on the contents of this information is strictly prohibited and may be unlawful. Mayberry may affect transactions or have positions in securities mentioned herein. In addition, employees of Mayberry may have positions and effect transactions in the securities mentioned herein.


