

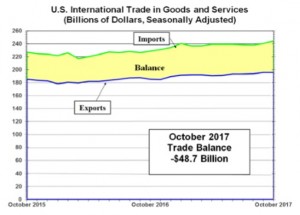
The U.S. Census Bureau and the U.S. Bureau of Economic Analysis, through the Department of Commerce, advised that the goods and services deficit for October 2017 was $48.7 billion compared to $44.9 billion, up $3.8 billion. Exports for October were $0.1 billion from September to $195.9 billion, while imports were valued at $244.6 billion, up $3.8 billion compared to September 2017.
The increase in the goods and services deficit was traced to an increase in the goods deficit of $3.8 billion to $69.1 billion and a decrease in the services surplus of less than $0.1 billion to $20.3 billion. According to the Bureau, “Year-to-date, the goods and services deficit increased $49.1 billion, or 11.9%, from the same period in 2016. Exports increased $97.5 billion or 5.3%. Imports increased $146.6 billion or 6.5%.”
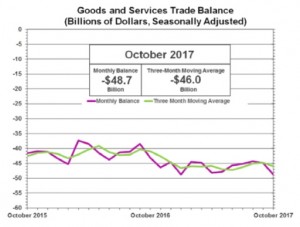
Goods and Services Three-Month Moving Averages
the average goods and services deficit for the three months ended October increase to $46 billion by $1.2 billion. The U.S. Census Bureau and the U.S. Bureau of Economic Analysis noted, “Average exports of goods and services increased $0.8 billion to $195.2 billion in October. Average imports of goods and services increased $2.0 billion to $241.2 billion in October.”
The average goods and services deficit year over year rose $5.1 billion from the quarter ended October 20116. Of this average export of goods and services climbed $8.2 billion from October 2016, while average imports for the corresponding period rose $13.2 billion.
The information contained herein has been obtained from sources believed to be reliable, however its accuracy and completeness cannot be guaranteed. You are hereby notified that any disclosure, copying, distribution or taking any action in reliance on the contents of this information is strictly prohibited and may be unlawful. Mayberry may effect transactions or have positions in securities mentioned herein. In addition, employees of Mayberry may have positions and effect transactions in the securities mentioned herein.