
May 14, 2024
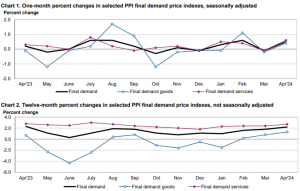
In April, the Producer Price Index (PPI) for final demand in the United States increased by 0.5 percent, as per the U.S. Bureau of Labor Statistics. This follows a slight decline of 0.1 percent in March and a prior rise of 0.6 percent in February. The 12-month analysis shows a notable uptick, with the index for final demand climbing by 2.2 percent, marking the most significant increase since April 2023, when it rose by 2.3 percent over the previous 12 months.
The bulk of the April increase in final demand prices can be attributed to a 0.6-percent rise in the index for final demand services, accounting for nearly three-quarters of the overall advance. Meanwhile, prices for final demand goods saw a more modest increase of 0.4 percent during the same period.
The index for final demand, excluding foods, energy, and trade services, increased by 0.4 percent, following a 0.2 percent rise in March. Over the 12 months leading up to April, prices for final demand, excluding these categories, surged by 3.1 percent. This marks the most substantial increase since April 2023, when it climbed by 3.4 percent over the preceding 12 months.
Final demand services
In April, the index for final demand services saw a significant increase of 0.6 percent, marking the largest rise since July 2023, when it surged by 0.8 percent. Seventy percent of this April increase was attributed to prices for final demand services excluding trade, transportation, and warehousing, which also advanced by 0.6 percent. Meanwhile, margins for final demand trade services rose by 0.8 percent, with trade indexes reflecting changes in margins received by wholesalers and retailers. However, prices for final demand transportation and warehousing services experienced a decrease of 0.6 percent during the same period.
In April, the surge in prices for final demand services was notably driven by a 3.9-percent increase in the portfolio management index, highlighting a significant rise in financial service costs. This upward trend was complemented by positive movements in several other sectors, including machinery and equipment wholesaling, residential real estate services (partial), automobile retailing (partial), guestroom rental, and truck transportation of freight. However, contrasting this growth, prices for airline passenger services experienced a substantial decline of 3.8 percent, indicative of challenges within the aviation industry. Additionally, the indexes for fuels and lubricants retailing, as well as gaming receipts (partial), saw decreases during the same period, reflecting varied pricing dynamics across different service sectors.
Final demand goods
In April, prices for final demand goods experienced a 0.4 percent increase, rebounding from a 0.2 percent decrease in March. This growth was primarily driven by a notable 2.0 percent rise in the index for final demand energy, indicating an uptick in energy-related costs. Meanwhile, prices for final demand goods excluding foods and energy saw a more moderate increase of 0.3 percent during the same period. Conversely, the index for final demand foods declined by 0.7 percent, suggesting a decrease in food-related prices.
In April, the index for final demand goods experienced a significant advance, with nearly three-quarters of this increase attributed to a substantial 5.4-percent rise in gasoline prices. This surge was complemented by positive movements in various other sectors, including diesel fuel, chicken eggs, electric power, nonferrous metals, and canned, cooked, smoked, or prepared poultry. However, there were notable declines in certain categories, such as a significant 18.7 percent decrease in prices for fresh and dry vegetables. Additionally, the indexes for residential natural gas and steel mill products also saw declines during the same period.
Disclaimer:
Analyst Certification – The views expressed in this research report accurately reflect the personal views of Mayberry Investments Limited Research Department about those issuer(s) or securities as at the date of this report. Each research analyst (s) also certify that no part of their compensation was, is, or will be, directly or indirectly, related to the specific recommendation(s) or view(s) expressed by that research analyst in this research report.
Company Disclosure – The information contained herein has been obtained from sources believed to be reliable, however its accuracy and completeness cannot be guaranteed. You are hereby notified that any disclosure, copying, distribution or taking any action in reliance on the contents of this information is strictly prohibited and may be unlawful. Mayberry may effect transactions or have positions in securities mentioned herein. In addition, employees of Mayberry may have positions and effect transactions in the securities mentioned herein.


