
March 14, 2024
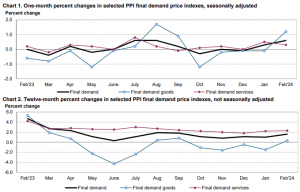
In February, the Producer Price Index for final demand in the United States increased by 0.6 percent, continuing a trend from January where it rose by 0.3 percent after a slight decrease of 0.1 percent in December 2023. This marks the largest rise in the index since September 2023, with a 1.6 percent increase over the 12 months ending in February. The surge in final demand prices was predominantly driven by a 1.2 percent increase in prices for final demand goods, while prices for final demand services experienced a more modest uptick of 0.3 percent.
The index for final demand excluding foods, energy, and trade services increased by 0.4 percent, following a 0.6 percent rise in January. Over the 12 months ending in February, prices for final demand excluding these components surged by 2.8 percent.
Final demand goods
In February, prices for final demand goods surged by 1.2 percent, marking the largest increase since August 2023, when it rose by 1.7 percent. A significant portion of this broad-based rise, nearly 70 percent, was attributable to the index for final demand energy, which jumped by 4.4 percent. Additionally, prices for final demand goods excluding foods and energy increased by 0.3 percent, while prices for final demand foods rose by 1.0 percent.
A significant portion of the advance in the index for final demand goods, one-third to be precise, was driven by a substantial 6.8-percent increase in gasoline prices. Additionally, prices for diesel fuel, chicken eggs, jet fuel, beef and veal, and tobacco products also experienced rises. Conversely, there were decreases in prices for hay, hayseeds, and oilseeds, which dropped by 8.3 percent. Moreover, the indexes for iron and steel scrap, as well as for asphalt, also recorded declines during the period.
Final demand services
In February, prices for final demand services increased by 0.3 percent, following a 0.5 percent rise in January. Leading this uptick was the index for final demand services excluding trade, transportation, and warehousing, which advanced by 0.5 percent. Additionally, prices for final demand transportation and warehousing services rose by 0.9 percent during the period. However, margins for final demand trade services experienced a decline of 0.3 percent. These fluctuations indicate varying price movements within the services sector, reflecting changes in demand, costs, and market dynamics, which collectively contribute to the overall inflationary landscape.
A notable portion of the increase in the index for final demand services, a quarter precisely, stemmed from a significant 3.8-percent rise in prices for traveller accommodation services. Additionally, other sectors such as outpatient care (partial), airline passenger services, loan services (partial), securities brokerage, dealing, and investment advice, as well as alcohol retailing, also experienced upward movements in their respective indexes. However, there were decreases in margins for chemicals and allied products wholesaling, which fell by 6.4 percent. Moreover, the indexes for automobiles and parts retailing, as well as for services related to securities brokerage and dealing (partial), also recorded declines.
Disclaimer:
Analyst Certification – The views expressed in this research report accurately reflect the personal views of Mayberry Investments Limited Research Department about those issuer(s) or securities as at the date of this report. Each research analyst (s) also certify that no part of their compensation was, is, or will be, directly or indirectly, related to the specific recommendation(s) or view(s) expressed by that research analyst in this research report.
Company Disclosure – The information contained herein has been obtained from sources believed to be reliable, however its accuracy and completeness cannot be guaranteed. You are hereby notified that any disclosure, copying, distribution or taking any action in reliance on the contents of this information is strictly prohibited and may be unlawful. Mayberry may effect transactions or have positions in securities mentioned herein. In addition, employees of Mayberry may have positions and effect transactions in the securities mentioned herein.


