
July 16, 2025
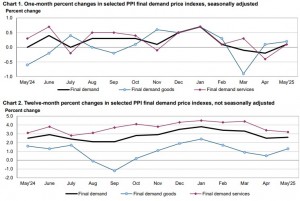
According to the U.S. Bureau of Labor Statistics , The Producer Price Index (PPI) for final demand in the U.S. was unchanged in June on a seasonally adjusted basis. This follows a 0.3 percent increase in May and a 0.3 percent decline in April. Over the 12 months ended June 2025, the index for final demand rose by 2.3 percent on an unadjusted basis.
In June, a 0.3 percent increase in prices for final demand goods was offset by a 0.1 percent decline in prices for final demand services.
Excluding foods, energy, and trade services, the index for final demand was unchanged in June, following a 0.1 percent increase in May. Over the past 12 months, this index has advanced by 2.5 percent.
Final demand goods
In June, the index for final demand goods rose 0.3 percent, the largest increase since February. Over half of the increase was due to a 0.3 percent rise in prices for goods excluding foods and energy. Prices for energy and food also rose, by 0.6 percent and 0.2 percent, respectively.
Notable contributors to the increase included a 0.8 percent rise in prices for communication and related equipment. Prices also rose for gasoline, residential electric power, prepared poultry, meats, and tree nuts. These gains were partially offset by a sharp 21.8 percent drop in chicken egg prices, along with declines in natural gas liquids and thermoplastic resins and plastics materials.
Final demand services
The index for final demand services edged down 0.1 percent in June, after a 0.4 percent increase in May. This decline was led by a 0.1 percent drop in services excluding trade, transportation, and warehousing. Prices for transportation and warehousing services fell 0.9 percent, while trade service margins were unchanged.
More than half of the overall decline was due to a 4.1 percent drop in prices for traveller accommodation services. Other decreases were seen in automobile retailing, deposit services, airline passenger services, and food and alcohol wholesaling. Offsetting these declines were gains in portfolio management (up 2.2 percent), as well as increases in machinery and equipment wholesaling, furniture retailing, and apparel and accessories retailing.
Disclaimer:
Analyst Certification – The views expressed in this research report accurately reflect the personal views of Mayberry Investments Limited Research Department about those issuer (s) or securities as at the date of this report. Each research analyst (s) also certify that no part of their compensation was, is, or will be, directly or indirectly, related to the specific recommendation(s) or view (s) expressed by that research analyst in this research report.
Company Disclosure – The information contained herein has been obtained from sources believed to be reliable, however its accuracy and completeness cannot be guaranteed. You are hereby notified that any disclosure, copying, distribution or taking any action in reliance on the contents of this information is strictly prohibited and may be unlawful. Mayberry may effect transactions or have positions in securities mentioned herein. In addition, employees of Mayberry may have positions and effect transactions in the securities mentioned herein.


