
October 27, 2022
U.S Third Quarter GDP increases 2.6% after two prior quarters of decline
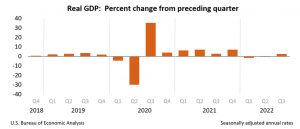
According to the Bureau of Economic Analysis’ “advance” estimate, real gross domestic product (GDP) expanded at an annual rate of 2.6 percent in the third quarter of 2022 relative to a 0.6% fall in the second quarter.
Increases in exports, consumer spending, non-residential fixed investment, federal government spending, and state and local government spending were all contributing factors to the rise in real GDP. However, these increases were partially offset by decreases in residential fixed investment and private inventory investment. Imports, which are deducted from GDP calculations, also fell.
Export growth was a result of rising sales of both products and services. Industrial supplies and materials, particularly petroleum and related items as well as other nondurable goods, as well as nonautomotive capital goods were the main drivers of the increase in exports of goods. Travel and “other” business services were the two sectors of the service exports that saw the most growth (mainly financial services).
An increase in services (driven by health care and “other” services) in consumer spending was partially offset by a decline in goods (led by motor vehicles and parts as well as food and beverages). Increases in equipment and intellectual property items in non-residential fixed investment were somewhat offset by a decline in structures. Defence spending accounted for the majority of the rise in federal spending. The increase in spending by state and local governments was mostly due to an increase in employee remuneration.
The principal causes of the decline in residential fixed investment were new single-family development and brokers’ commissions. A decline in retail commerce was the main factor contributing to the decline in private inventory investment (led by “other” retailers). A decline in imports of products, particularly consumer items, was partially offset by an uptick in imports of services (mainly travel).
Following a decline of 0.6 percent in the second quarter, real GDP increased in the third quarter by 2.6 percent. The improvement was primarily caused by a lower decline in private inventory investment, an acceleration in non-residential fixed investment, and an increase in federal government spending, which were only partially offset by a larger decline in residential fixed investment and a slowdown in consumer spending. Imports turned down.
Current‑dollar GDP increased 6.7 percent at an annual rate, or $414.8 billion, in the third quarter to a level of $25.66 trillion. In the second quarter, GDP increased 8.5 percent, or $508.0 billion.
The price index for gross domestic purchases increased 4.6 percent in the third quarter, relative to an increase of 8.5 percent in the second quarter.
The PCE price index increased 4.2 percent, compared to an increase of 7.3 percent in the second quarter. Excluding food and energy prices, the PCE price index increased 4.5 percent, compared with an increase of 4.7 percent.
Personal Income
Current-dollar personal income increased $291.2 billion in the third quarter, compared with an increase of $305.7 billion in the second quarter. The increase primarily reflected increases in compensation (led by private wages and salaries) and personal income receipts on assets.
Disposable personal income increased $268.3 billion, or 6.0 percent, in the third quarter, compared with an increase of $253.3 billion, or 5.7 percent, in the second quarter. Real disposable personal income increased 1.7 percent, in contrast to a decrease of 1.5 percent.
Personal saving was $626.1 billion in the third quarter, compared with $629.0 billion in the second quarter. The personal saving rate—personal saving as a percentage of disposable personal income—was 3.3 percent in the third quarter, compared with 3.4 percent in the second quarter.
Disclaimer:
Analyst Certification -The views expressed in this research report accurately reflect the personal views of Mayberry Investments Limited Research Department about those issuer (s) or securities as at the date of this report. Each research analyst (s) also certify that no part of their compensation was, is, or will be, directly or indirectly, related to the specific recommendation(s) or view (s) expressed by that research analyst in this research report.
Company Disclosure -The information contained herein has been obtained from sources believed to be reliable, however its accuracy and completeness cannot be guaranteed. You are hereby notified that any disclosure, copying, distribution or taking any action in reliance on the contents of this information is strictly prohibited and may be unlawful. Mayberry may affect transactions or have positions in securities mentioned herein. In addition, employees of Mayberry may have positions and effect transactions in the securities mentioned herein.


