
January 10, 2025
According to the U.S. Bureau of Labor Statistics, total nonfarm payroll employment rose by 256,000 in December, and the unemployment rate changed little at 4.1 percent. Notably, employment trended up in health care, government, and social assistance. Also, retail trade added jobs in December, following job loss in November. The U.S. Bureau of Labor Statistics reported these findings based on two monthly surveys: the household survey, which assesses labour force status, including unemployment by demographic characteristics, and the establishment survey, which measures nonfarm employment, hours, and earnings by industry.
Household Survey Data
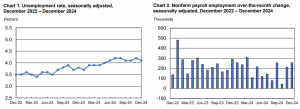
In December, the U.S. labour market showed minimal change in key indicators compared to the previous month. The unemployment rate remained at 4.1%, with 6.9 million people unemployed. This rate has been stable between 4.1% and 4.2% for the past seven months. Among demographic groups, the unemployment rate for Whites edged down to 3.6%, while rates for adult men (3.7%), adult women (3.8%), teenagers (12.4%), Blacks (6.1%), Asians (3.5%), and Hispanics (5.1%) showed little or no change.
The number of permanent job losers declined by 164,000 to 1.7 million in December, but this figure is similar to a year earlier. The number of people on temporary layoff remained at 862,000, showing little change over the month and year. The number of long-term unemployed (those jobless for 27 weeks or more) was little changed at 1.6 million in December, up by 278,000 from a year earlier, comprising 22.4% of all unemployed people. The labour force participation rate remained stable at 62.5%, and the employment-population ratio held at 60.0%.
The number of people employed part-time for economic reasons was 4.4 million, showing little change from a year earlier. Additionally, 5.5 million people not in the labour force expressed a desire for employment but were not actively seeking work. Of these, 1.6 million were marginally attached to the labour force, with the number of discouraged workers remaining little changed at 480,000.
Establishment Survey Data
In December, total nonfarm payroll employment rose by 256,000, with notable gains in health care, government, and social assistance. Retail trade also added jobs following a loss in November. Over the year 2024, payroll employment increased by 2.2 million, averaging a monthly gain of 186,000, which is less than the 3.0 million increase in 2023, averaging 251,000 per month. Health care added 46,000 jobs in December, with significant contributions from home health care services, nursing and residential care facilities, and hospitals. Retail trade saw an increase of 43,000 jobs, particularly in clothing and accessories, general merchandise, and health and personal care retailers, despite losses in building material and garden equipment dealers.
Government employment continued to trend up in December, adding 33,000 jobs, with state government employment also increasing. Social assistance employment rose by 23,000, mainly in individual and family services. Leisure and hospitality employment changed little, adding 43,000 jobs in December, with an average monthly gain of 24,000 jobs in 2024, about half the average monthly gain in 2023. Other major industries, including mining, quarrying, oil and gas extraction, construction, manufacturing, wholesale trade, transportation and warehousing, information, financial activities, professional and business services, and other services, showed little change in employment over the month.
Average hourly earnings for all employees on private nonfarm payrolls increased by 10 cents, or 0.3 percent, to $35.69 in December, with a 3.9 percent increase over the past 12 months. The average workweek for all employees on private nonfarm payrolls remained at 34.3 hours for the fifth consecutive month. In manufacturing, the average workweek was steady at 40.0 hours, with a slight decrease in overtime. Revisions to October and November data resulted in a net decrease of 8,000 jobs from previously reported figures.
Disclaimer:
Analyst Certification – The views expressed in this research report accurately reflect the personal views of Mayberry Investments Limited Research Department about those issuer (s) or securities as at the date of this report. Each research analyst (s) also certify that no part of their compensation was, is, or will be, directly or indirectly, related to the specific recommendation(s) or view (s) expressed by that research analyst in this research report.
Company Disclosure – The information contained herein has been obtained from sources believed to be reliable, however its accuracy and completeness cannot be guaranteed. You are hereby notified that any disclosure, copying, distribution or taking any action in reliance on the contents of this information is strictly prohibited and may be unlawful. Mayberry may effect transactions or have positions in securities mentioned herein. In addition, employees of Mayberry may have positions and effect transactions in the securities mentioned herein.

